Figure 5.

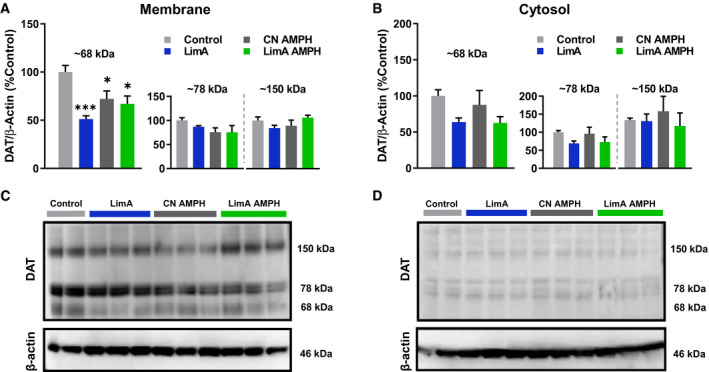
Dopamine transporter (DAT) protein levels. Western blot quantification of DAT protein (normalized to β‐actin) from enriched membrane and cytosolic fractions of nucleus accumbens brain tissue. Normalized DAT protein in each group was expressed as a percentage of that of the control group. (A) Histological representation of DAT band density at ~150, 78, and 68 kDa in membrane fractions and (B) cytosolic fractions showed a reduced density of only the 68‐kDa DAT band in all groups compared with the control group. Representative blots showing DAT band density at 150, 78, and 68 kDa, as well as the 46‐kDa β‐actin band containing (C) membrane and (D) cytosolic samples. All data reflect the mean ± SEM (*P < 0.05; ***P < 0.001).
