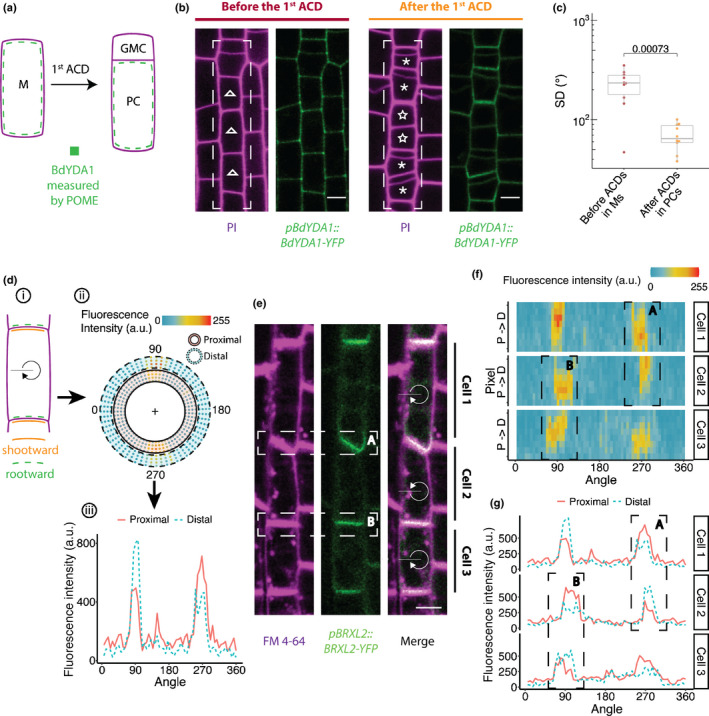
Fig. 4.

Application of Pome to quantifying polarity in diverse cell types. (a–c) Pome reveals BdYDA1 is polarised in Brachypodium stomatal lineage cells. (a) Schematic of the cell types in the Brachypodium stomatal lineage. Meristemoids (M) divide asymmetrically to generate one small guard mother cell precursor (GMC) and one large pavement cell precursor (PC). (b) pBdYDA1::BdYDA1‐YFP (green) localisation pattern in stomatal lineage cells (indicated by white‐dashed boxes) before (left) and after (right) the first asymmetric cell divisional (ACD). Cell boundaries are visualised by propidium iodide (PI, magenta). Ms are labelled with open triangles and PCs with asterisks. Note that not all the Ms have undergone ACDs in the right panel. The two Ms in the middle (labelled with stars) have not divided yet and exhibit no BdYDA1 polarity. (c) Plot of the SD indicates that BdYDA1 is not polarised in meristemoids (pre‐ACD), but is polarised in PC precursors (n = 10 cells/stage). (d–g) Application of Pome to determine shootward or rootward polarity in contiguous cells. (d) Scheme of how Pome can be used to determine which of two adjacent cells is expressing a polarised marker. (i) In contiguous cells, a polarised protein could be localised to the upper side (shootward, orange line) and/or the lower side (rootward, green dashed line). Pome can be applied to distinguish these different patterns. The black line indicates the 0° angle and the clockwise arrow indicates the direction of rotation for Pome measurement. Pome measurement of a rootward polarity protein containing cell is shown in ii) and iii). (ii) Reconstruction of marker localisation in proximal and distal membrane regions. Fluorescence in the proximal membrane region (within the solid rings) is contributed by the selected cell, while fluorescence in the distal membrane region (within the dashed rings) is contributed by the neighbouring cells. (iii) Comparison of the marker intensity in the proximal (solid red line) and distal regions (dashed blue line) at a particular angle indicates whether the signal at the membrane is mostly coming from the neighbouring cell (as shown at 90°) or from the target cell (as shown at 270°). (e) Rootward localisation of BRXL2 (green) in three adjacent lateral root cap cells in Arabidopsis. Plasma membrane visualised with FM4‐64 (magenta). Regions of interest (ROIs) analysed to determine on which side of the shared interphase a polarised protein resides are indicated by dashed boxes labelled as region A and region B in (e), (f) and (g). (f) Heat map of the fluorescence intensity of the BRXL2 localisation shown in (e). For each angle, the four innermost and outermost pixels are considered the proximal (P) and distal (D) membrane regions, respectively. (g) For the three cells shown in (e), the total fluorescence intensities of the proximal (solid red line) and distal (dashed blue line) membrane regions are plotted at each angle. Bars in (b, e), 5 μm.
