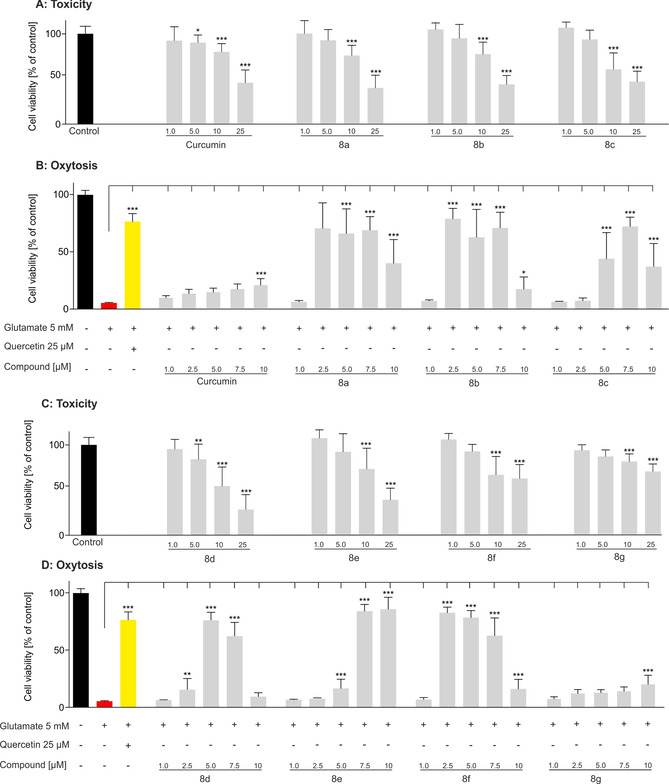
Figure 5.

Neuroprotection and neurotoxicity were determined in HT22 cells. 5 mm glutamate (red) induced cell death, 25 μm quercetin (yellow) served as a positive control for cell survival: A) neurotoxicity of curcumin and 8 a–c; B) neuroprotection of curcumin and 8 a–c; C) neurotoxicity of 8 d–g; D) neuroprotection of 8 d–g. Data are presented as means±SEM of three independent experiments and results refer to untreated control cells (black). Statistical analysis was performed by using one‐way analysis of variance (ANOVA) followed by Dunnett's multiple comparison post‐test by using GraphPad Prism 5, with reference to cells treated with 5 mm glutamate. Level of significance: ***p<0.001, **p<0.01, *p<0.05.
