FIGURE 4.

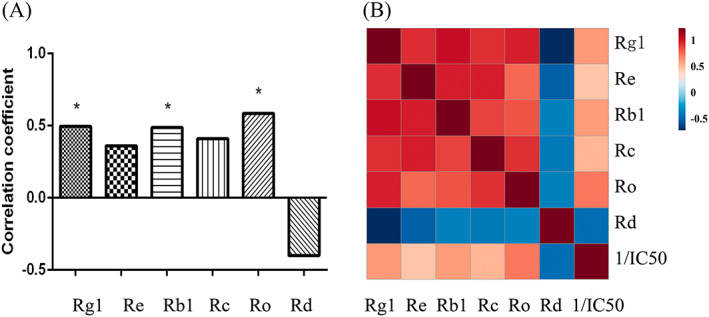
Correlation analysis. (A) Pearson correlation coefficient between the IC50 value and peak area of six common peaks. (B) Thermograph of the correlation analysis of all factors [Colour figure can be viewed at wileyonlinelibrary.com]

Correlation analysis. (A) Pearson correlation coefficient between the IC50 value and peak area of six common peaks. (B) Thermograph of the correlation analysis of all factors [Colour figure can be viewed at wileyonlinelibrary.com]