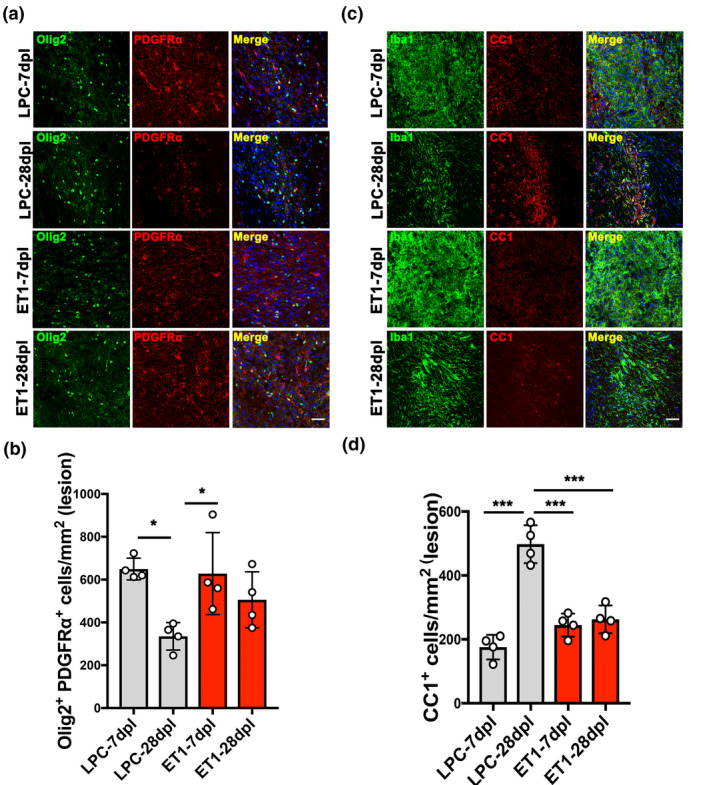
Figure 5.

Analysis of oligodendrocyte lineage cells in internal capsule (IC) lesions. (a) Double immunofluorescence images of lysophosphatidylcholine (LPC)‐lesioned IC‐ and endothelin‐1 (ET1)‐lesioned IC at 7 and 28 dpl labeled with anti‐Olig2 (green) and anti‐platelet‐derived growth factor receptor α chain (PDGFRα) (red) antibodies. Nuclei were counterstained with Hoechst (blue). Scale bar, 50 µm. (b) Quantification of the density of Olig2 and PDGFRα double‐positive cells in LPC‐ versus. ET1‐induced IC lesions at 7 and 28 dpl (n = 4 mice/group). (c) Double immunofluorescence images of LPC‐lesioned IC and ET1‐lesioned IC at 7 and 28 dpl labeled with anti‐ionized calcium‐binding adapter molecule 1 (green) and anti‐CC1 (red) antibodies. Nuclei were counterstained with Hoechst (blue). Scale bar, 50 µm. (d) Quantification of CC1‐positive cells in LPC‐ versus. ET1‐induced IC lesions at 7 and 28 dpl (n = 4 mice/group). Mean ± SD. One‐way ANOVA, Tukey–Kramer test. *p < .05, ***p < .001
