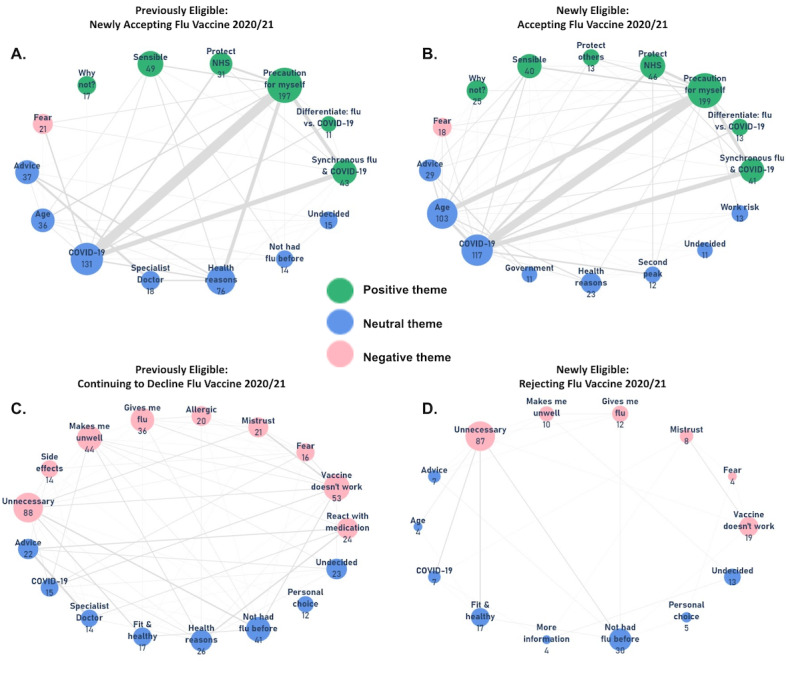
Figure 2.

Study participants (N=1624) from UK-wide responses to web-based questionnaires administered through Care Information Exchange (influenza-related questionnaire sent July 31, 2020); network diagram of free-text responses (n=1453, 89.5%). Responses from previously eligible respondents who had previously not accepted the influenza vaccine but would (A) accept it in 2020-2021 (n=478) or (B) continue to decline it (n=356); responses from newly eligible participants who would (C) accept vaccination (n=432) or (D) decline it (n=187). A connecting line (edge) between nodes implies at least one response in which themes of connected nodes co-occurred; the thickness of the line corresponds to the frequency of co-occurrence. Flu: influenza; NHS: National Health Service.
