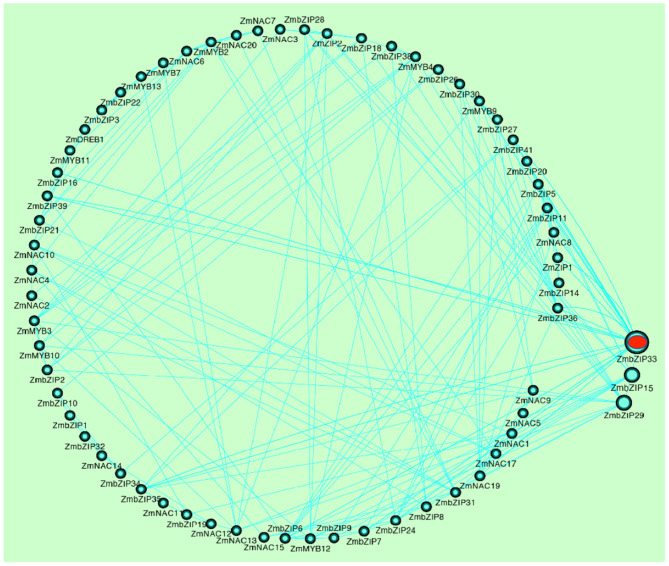
Figure 2.
The gene co-expression network of TFs. The gene co-expression network between 77 TFs was constructed by Cytoscape software (correlation coefficient is greater than 0.75). The straight line represents a correlation between genes. The circle represents the TFs, and the larger the circle, the more connected to other TFs.

