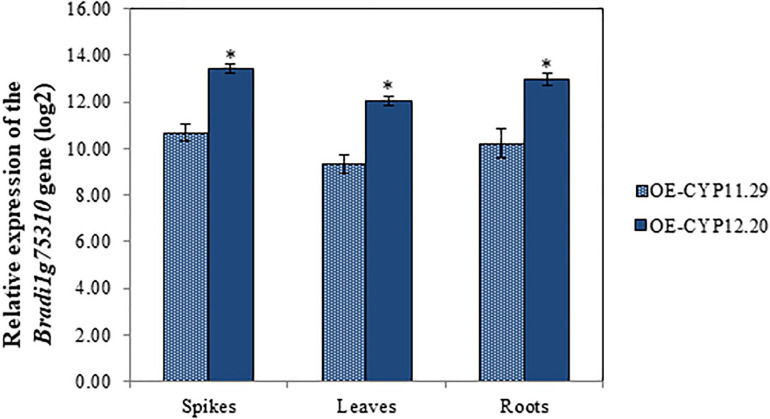
FIGURE 4.
Molecular characterization of B. distachyon lines overexpressing the BdCYP711A29 gene. Relative expression of the BdCYP711A29 gene in spikes. leaves and roots of overexpressing lines OE-CYP11.29 and OE-CYP12.20. The relative quantity of BdCYP711A29 transcripts (fold-change. log2) of OE lines as compared with the Bd21-3 WT line was calculated using the comparative cycle threshold method (2– ΔΔCt). The B. distachyon UBC18 and ACT7 genes (Bradi4g00660 and Bradi4g41850) were used as endogenous controls to normalize the data for differences in input RNA between the different samples. Data represent mean values of three independent biological experiments (n = 3) and two technical repetitions ± standard deviation. Different letters indicate significant differences between conditions (Student’s t-test p value < 0.01).

