
FIGURE 2.
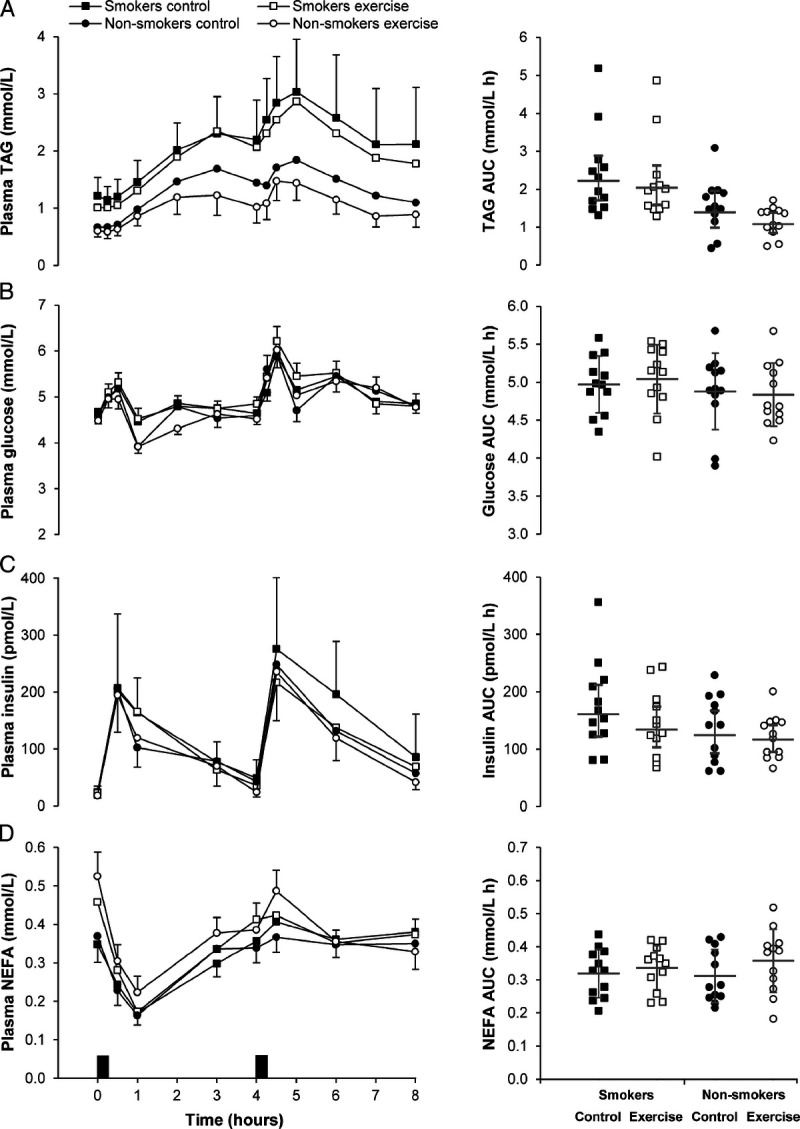
Plasma concentrations of TAG (A), glucose (B), insulin (C), and NEFA (D) in the exercise and control conditions for male cigarette smokers (n = 12) and male nonsmokers (n = 12). Data points on left-hand panels represent geometric mean (95% CI) for TAG and insulin, and mean ± SEM for glucose and NEFA. Black rectangles indicate consumption of breakfast and lunch meals. Data points on right-hand panels represent individual data values for time-averaged total area under the curve (AUC) (0–8 h). The gray solid line (—) indicates the geometric mean (95% CI) for TAG and insulin, and mean ± SD for glucose and NEFA. Linear mixed models for time-averaged total AUC (0–8 h) identified a main effect of group for TAG (P = 0.004), and a main effect of condition for TAG (P = 0.002), insulin (P = 0.038), and NEFA (P = 0.044). No group–condition interactions were identified (all P ≥ 0.089).