
FIGURE 3.
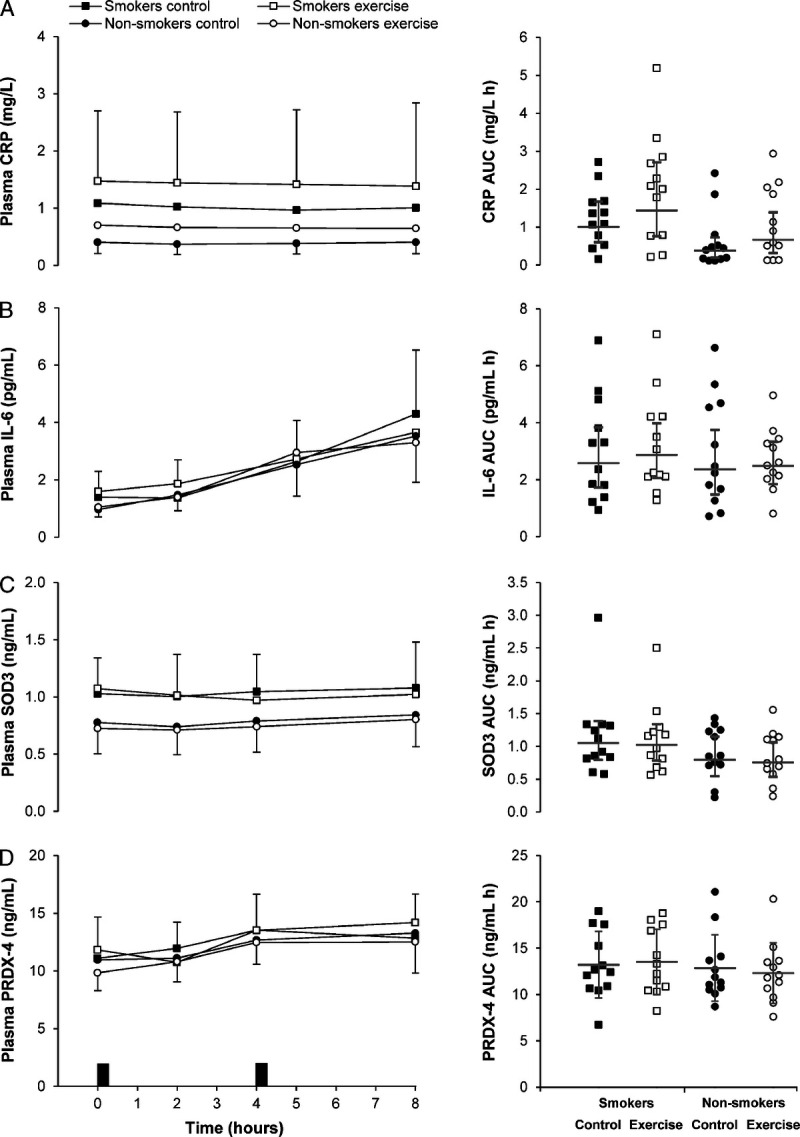
Plasma concentrations of CRP (A), IL-6 (B), SOD3 (C), and PRDX-4 (D) in the exercise and control conditions for male cigarette smokers (n = 12) and male nonsmokers (n = 12). Data points on left-hand panels represent geometric mean (95% CI). Black rectangles indicate consumption of breakfast and lunch meals. Data points on right-hand panels represent individual data values for time-averaged total area under the curve (AUC) (0–8 h), and the gray solid line (―) indicates the geometric mean (95% CI). Linear mixed models for time-averaged total AUC (0–8 h) identified a main effect of group for CRP (P = 0.034), and a main effect of condition for CRP (P = 0.004). No group–condition interactions were identified (all P ≥ 0.386).