
Figure 1.
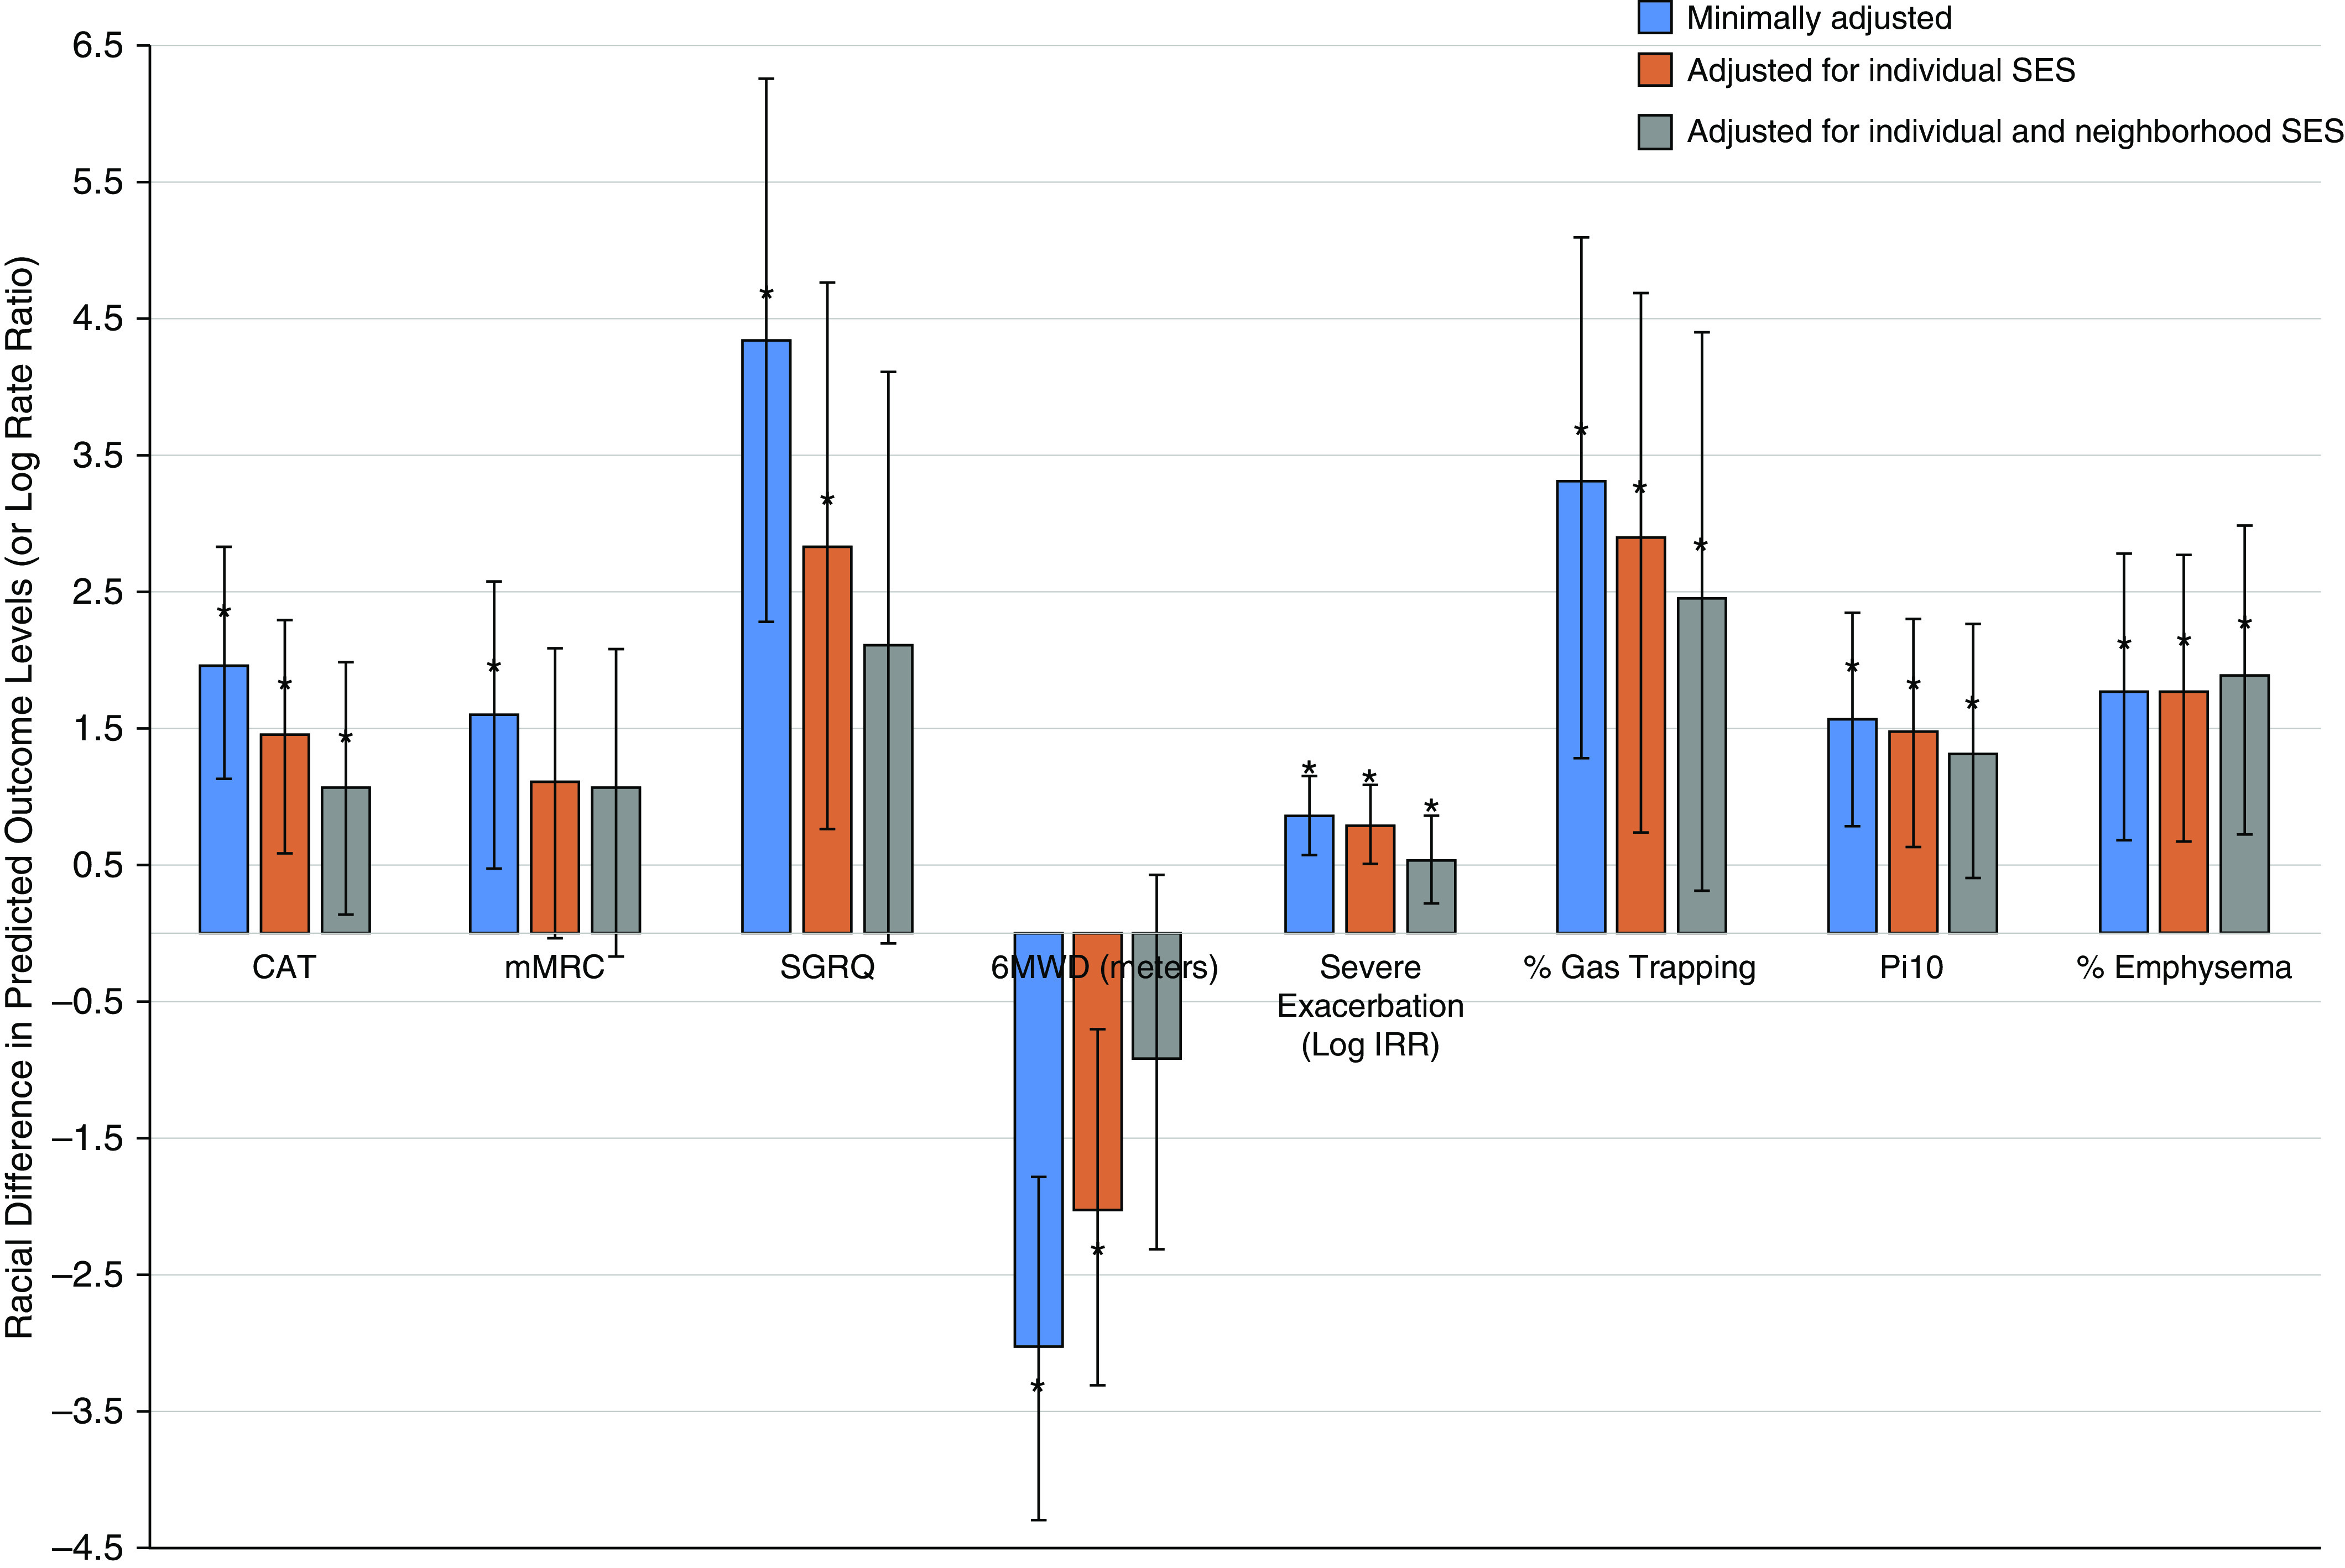
Differences in respiratory outcomes between Black individuals and white individuals are attenuated by individual and neighborhood socioeconomic status (SES). Predicted mean difference in chronic obstructive pulmonary disease outcomes and their 95% confidence intervals are shown sequentially across the following three models: model 1 (blue), which adjusts for demographic and individual characteristics; model 2 (red), which also adjusts model 1 for individual SES; model 3 (gray), which also adjusts model 2 for neighborhood SES. The y-axis represents the differences between Black individuals and white individuals in the levels of the outcome (e.g., index score) except for severe exacerbation, for which the y-axis represents log incident rate ratio. The modified Medical Research Council scale, 6-minute-walk test distance, and airway wall thickness (internal perimeter of 10 mm) were rescaled to fit the chart; the modified Medical Research Council score was multiplied by 10, the 6-minute-walk test distance was divided by 10, and the airway wall thickness (internal perimeter of 10 mm) was multiplied by 100. *Statistical significance of difference in the outcome between Black individuals and white individuals. 6MWD = 6-minute-walk test distance; CAT = COPD Assessment Test; COPD = chronic obstructive pulmonary disease; IRR = incident rate ratio; mMRC = modified Medical Research Council scale; Pi10 = internal perimeter of 10 mm; SGRQ = St. George’s Respiratory Questionnaire.