
Figure 5.
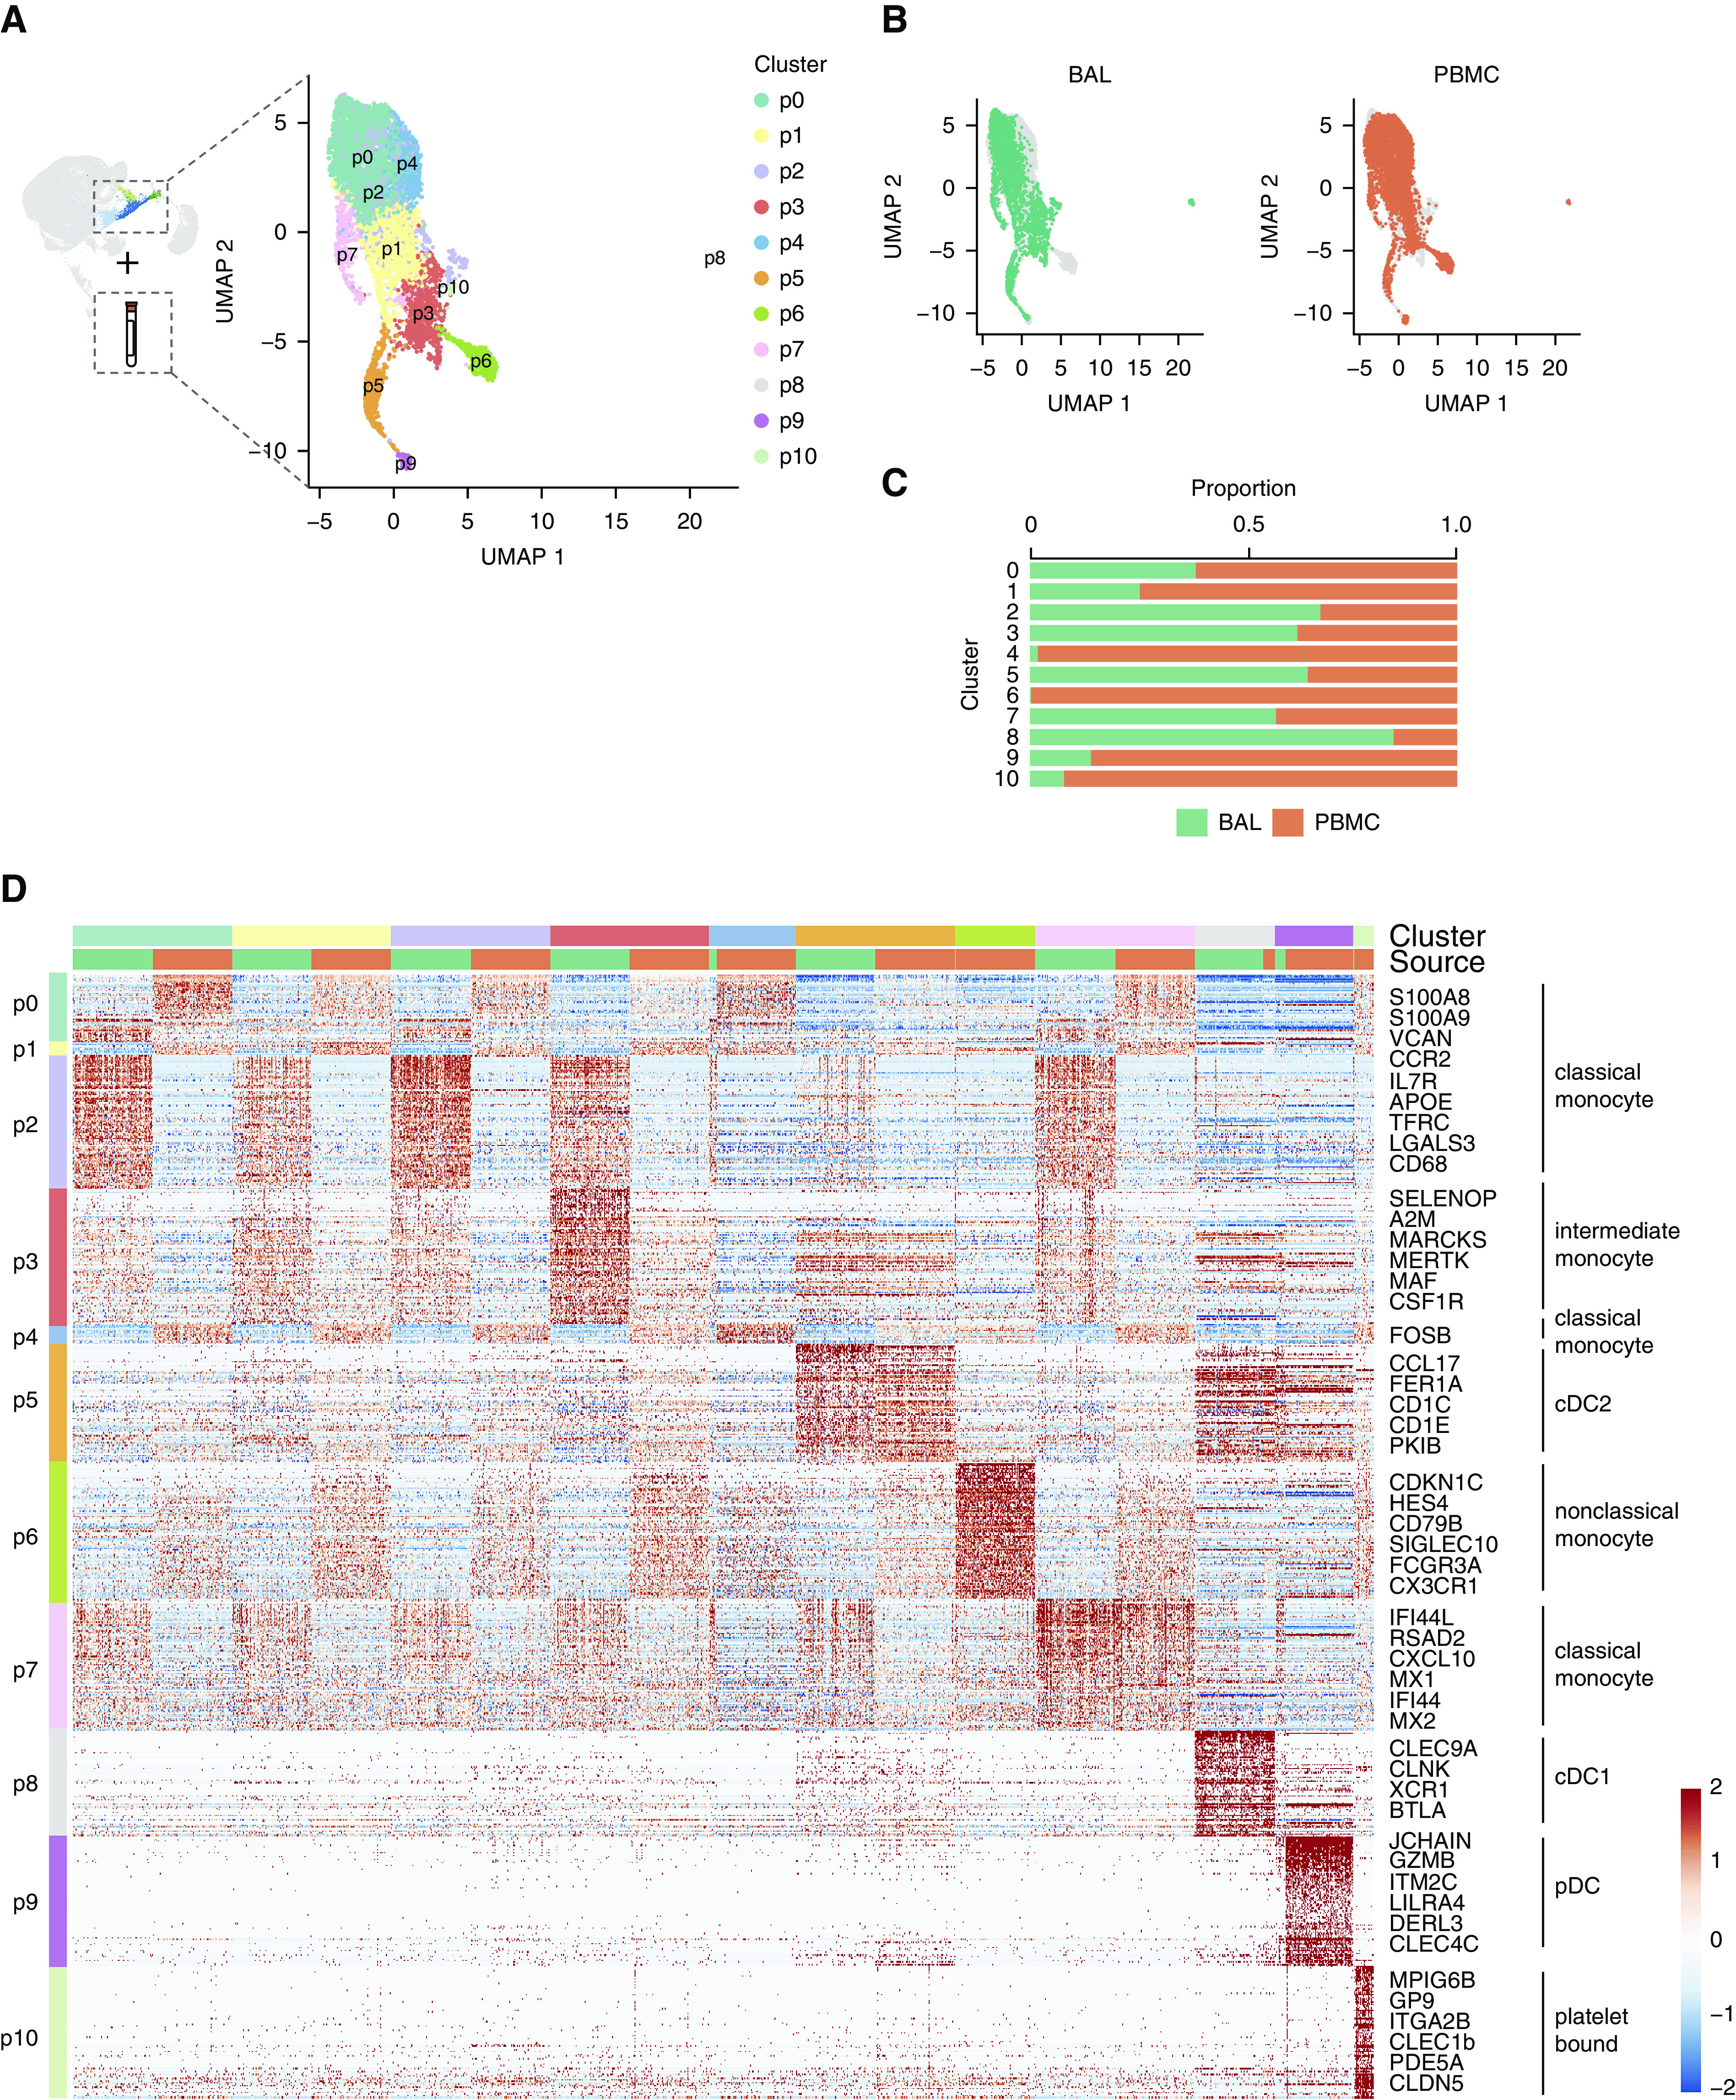
Monocyte-like cells are aligned but distinct from circulating blood cells. (A) Monocyte-like cells from BAL (Figure 1 cluster 5) were integrated with peripheral blood monocytes and reclustered. Color specifies assignment of cells to one of 11 clusters, labeled p0–11. (B) Contributions of cells from BAL or PBMCs to UMAP projection. (C) Relative proportion of cells within each cluster from BAL or PBMCs. (D) Heat map of cell clusters with select marker genes and annotations highlighted. Up to 100 cells were randomly selected from BAL and PBMC samples in each cluster for inclusion in the heat map. Up to the top 100 markers significant in at least two individual samples were included for each cluster. The heat map is colored by scaled log-normalized expression. cDC = conventional dendritic cell; PBMC = peripheral blood mononuclear cell; pDC = plasmacytoid dendritic cell; UMAP = uniform manifold approximation and projection.