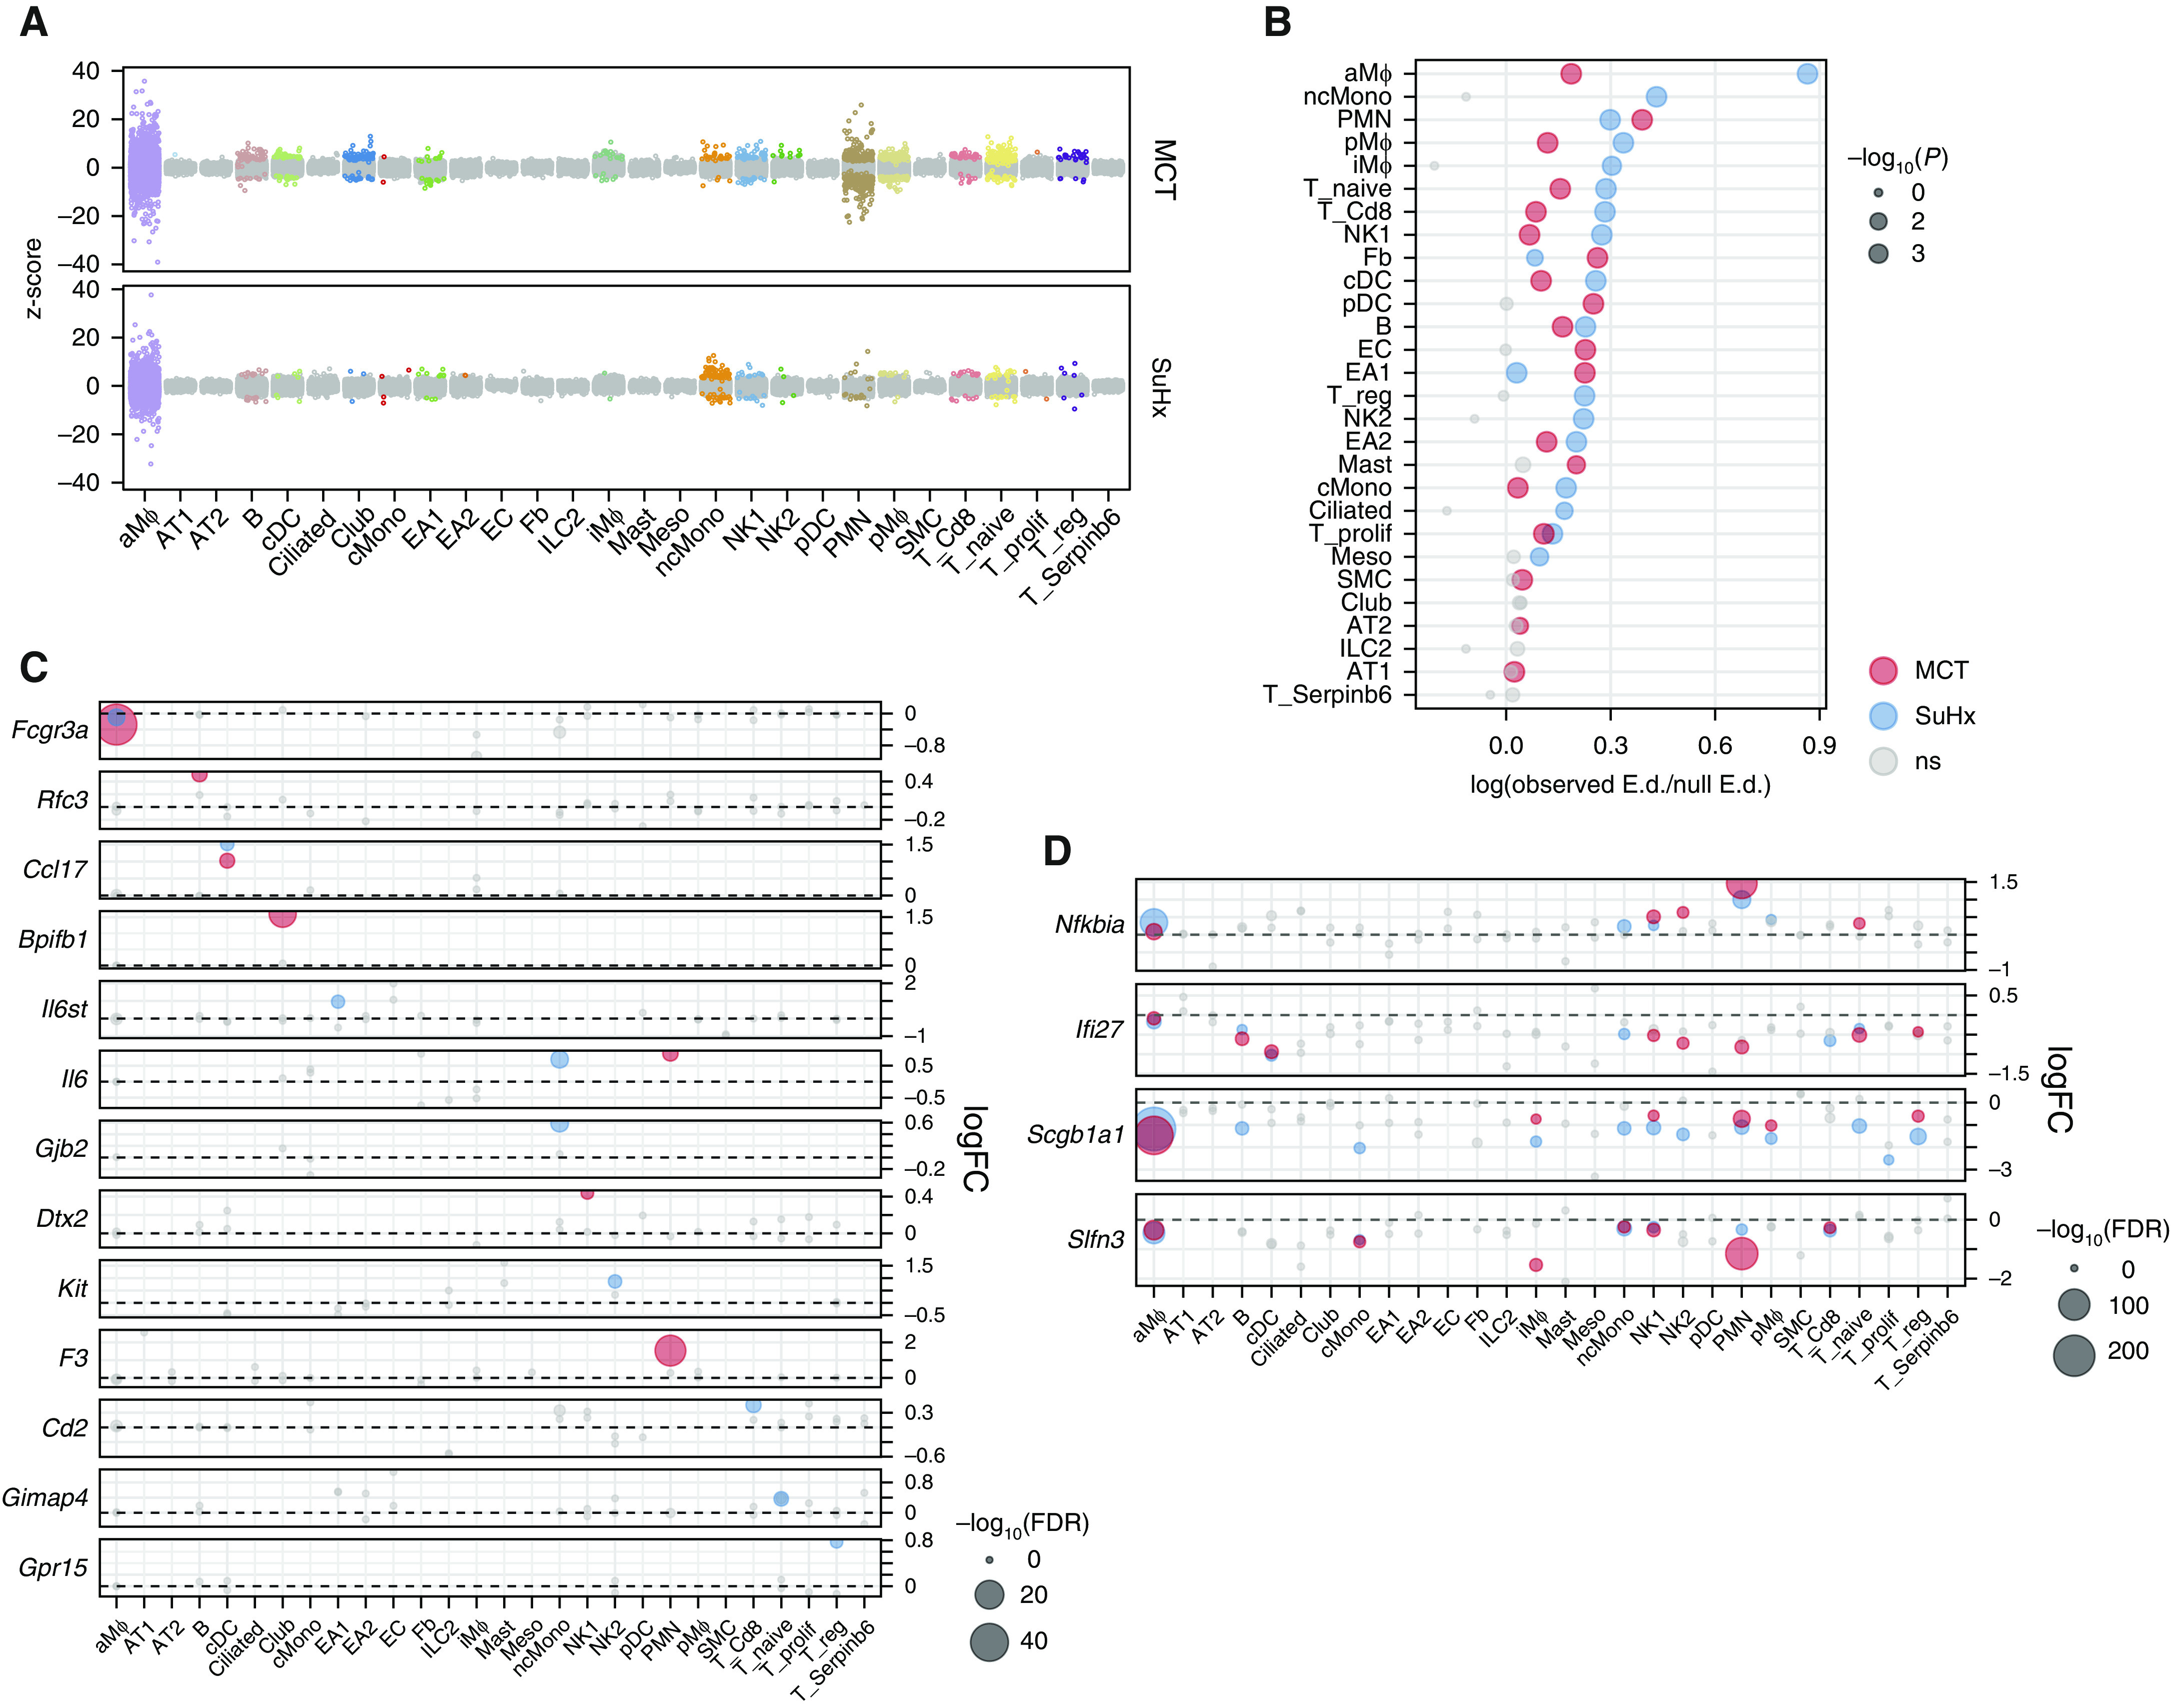
Figure 3.

Single-cell RNA sequencing reveals differentially expressed genes (DEGs) in individual cell types of pulmonary arterial hypertension models. (A) Jitter plot showing changes in gene expression for each cell type due to monocrotaline (MCT) (top) or Sugen-hypoxia (SuHx) (bottom) conditions compared with the control condition. Each dot represents the differential expression MAST (Model-based Analysis of Single-Cell Transcriptomics) z-score of a gene. Dots indicating a false discovery rate (FDR) < 0.05 are in color. The gray dots indicate values that were not significant (ns). (B) Dot plot showing shifts in gene expression on a whole-transcriptome scale within each cell type for MCT (red) and SuHx (blue) models compared with the control model using a Euclidean distance (E.d.)-based statistical approach as previously described (14). The x-axis shows the log ratio of observed-to-null E.d. The alveolar macrophages and nonclassical monocytes from the SuHx model demonstrated the strongest global shifts in gene expression from the control model. (C) Dot plot comparing DEGs across cell types and disease models shows genes whose differential expression was specific to a disease model and a particular cell type. For example, Gpr15, which encodes an orphan G protein–linked receptor believed to be important in regulatory T cell (Treg) homing (22), was exclusively upregulated in Tregs from SuHx rats. (D) Dot plot showing DEGs consistent across immune-cell types. For instance, Ifi27, which encodes IFNα-inducible protein 27 and plays a role in apoptosis and vascular response to injury (23, 24), was downregulated across cell types in both models. (C and D) The horizontal dashed line for each gene represents zero logFC. (B–D) Gray dots indicate values that were ns, and the size of the dots corresponds to −log10(P) values (B) and −log10(FDR) values (C and D). logFC = log fold change.
