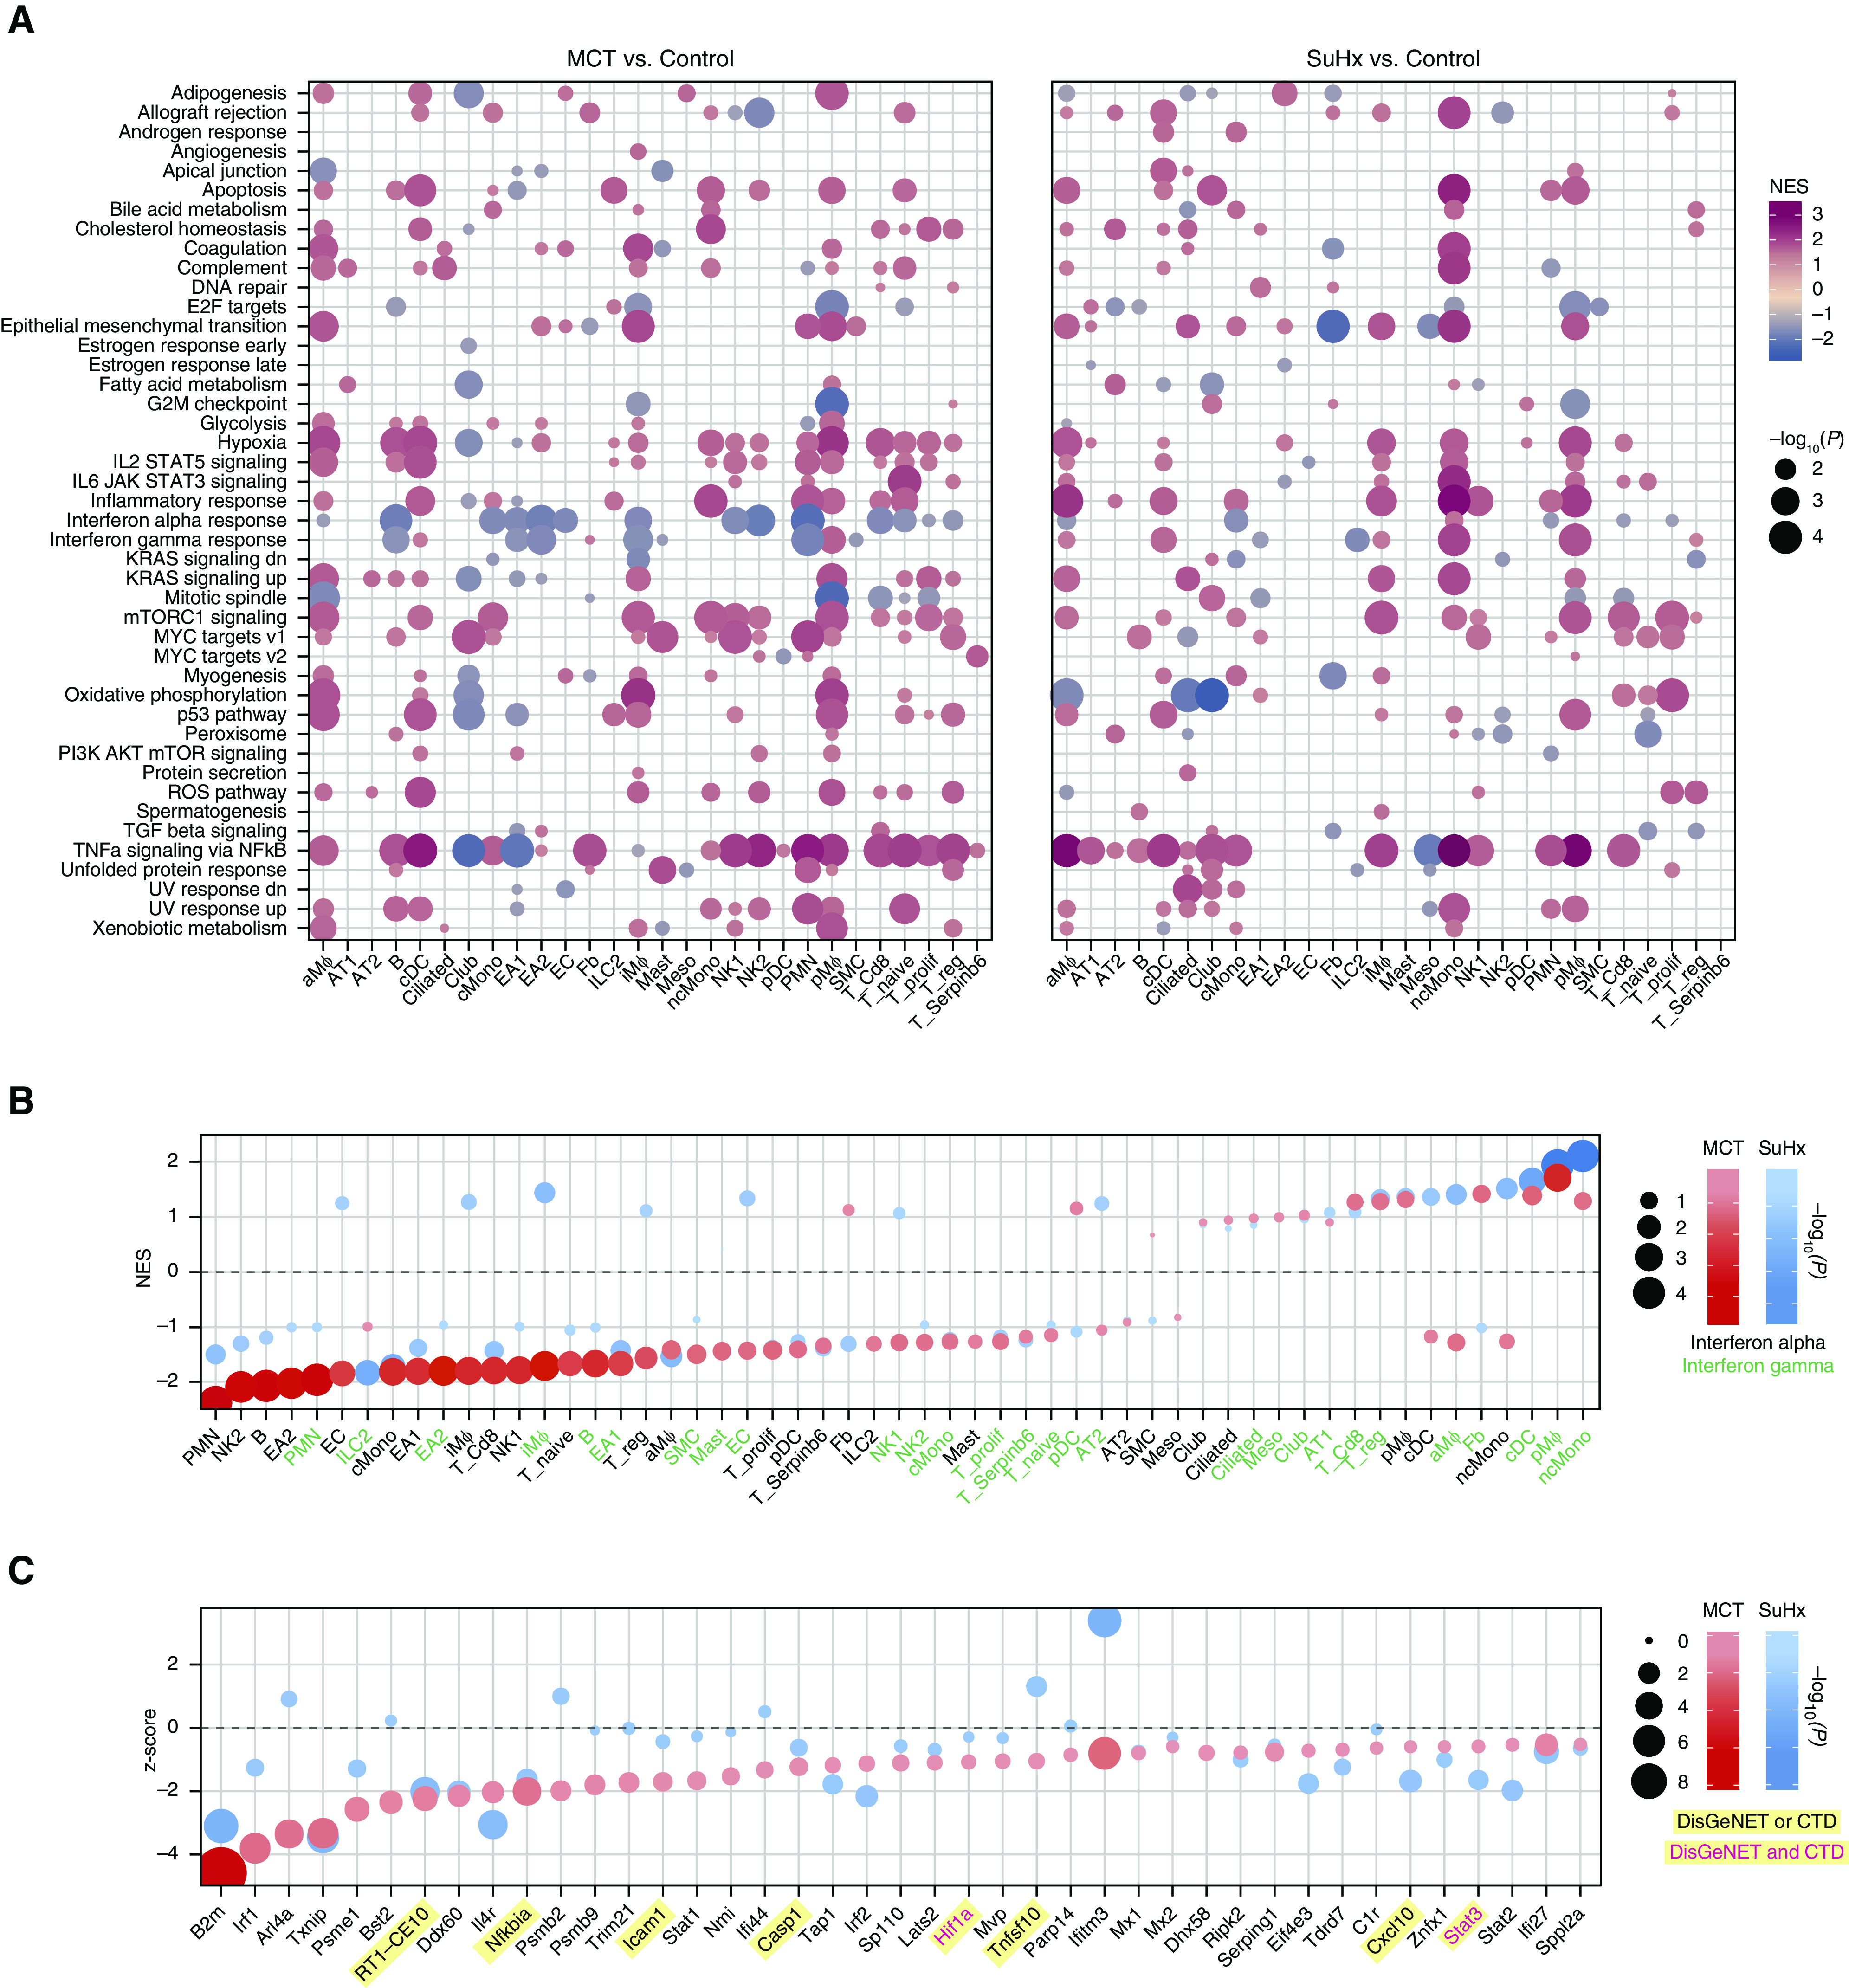
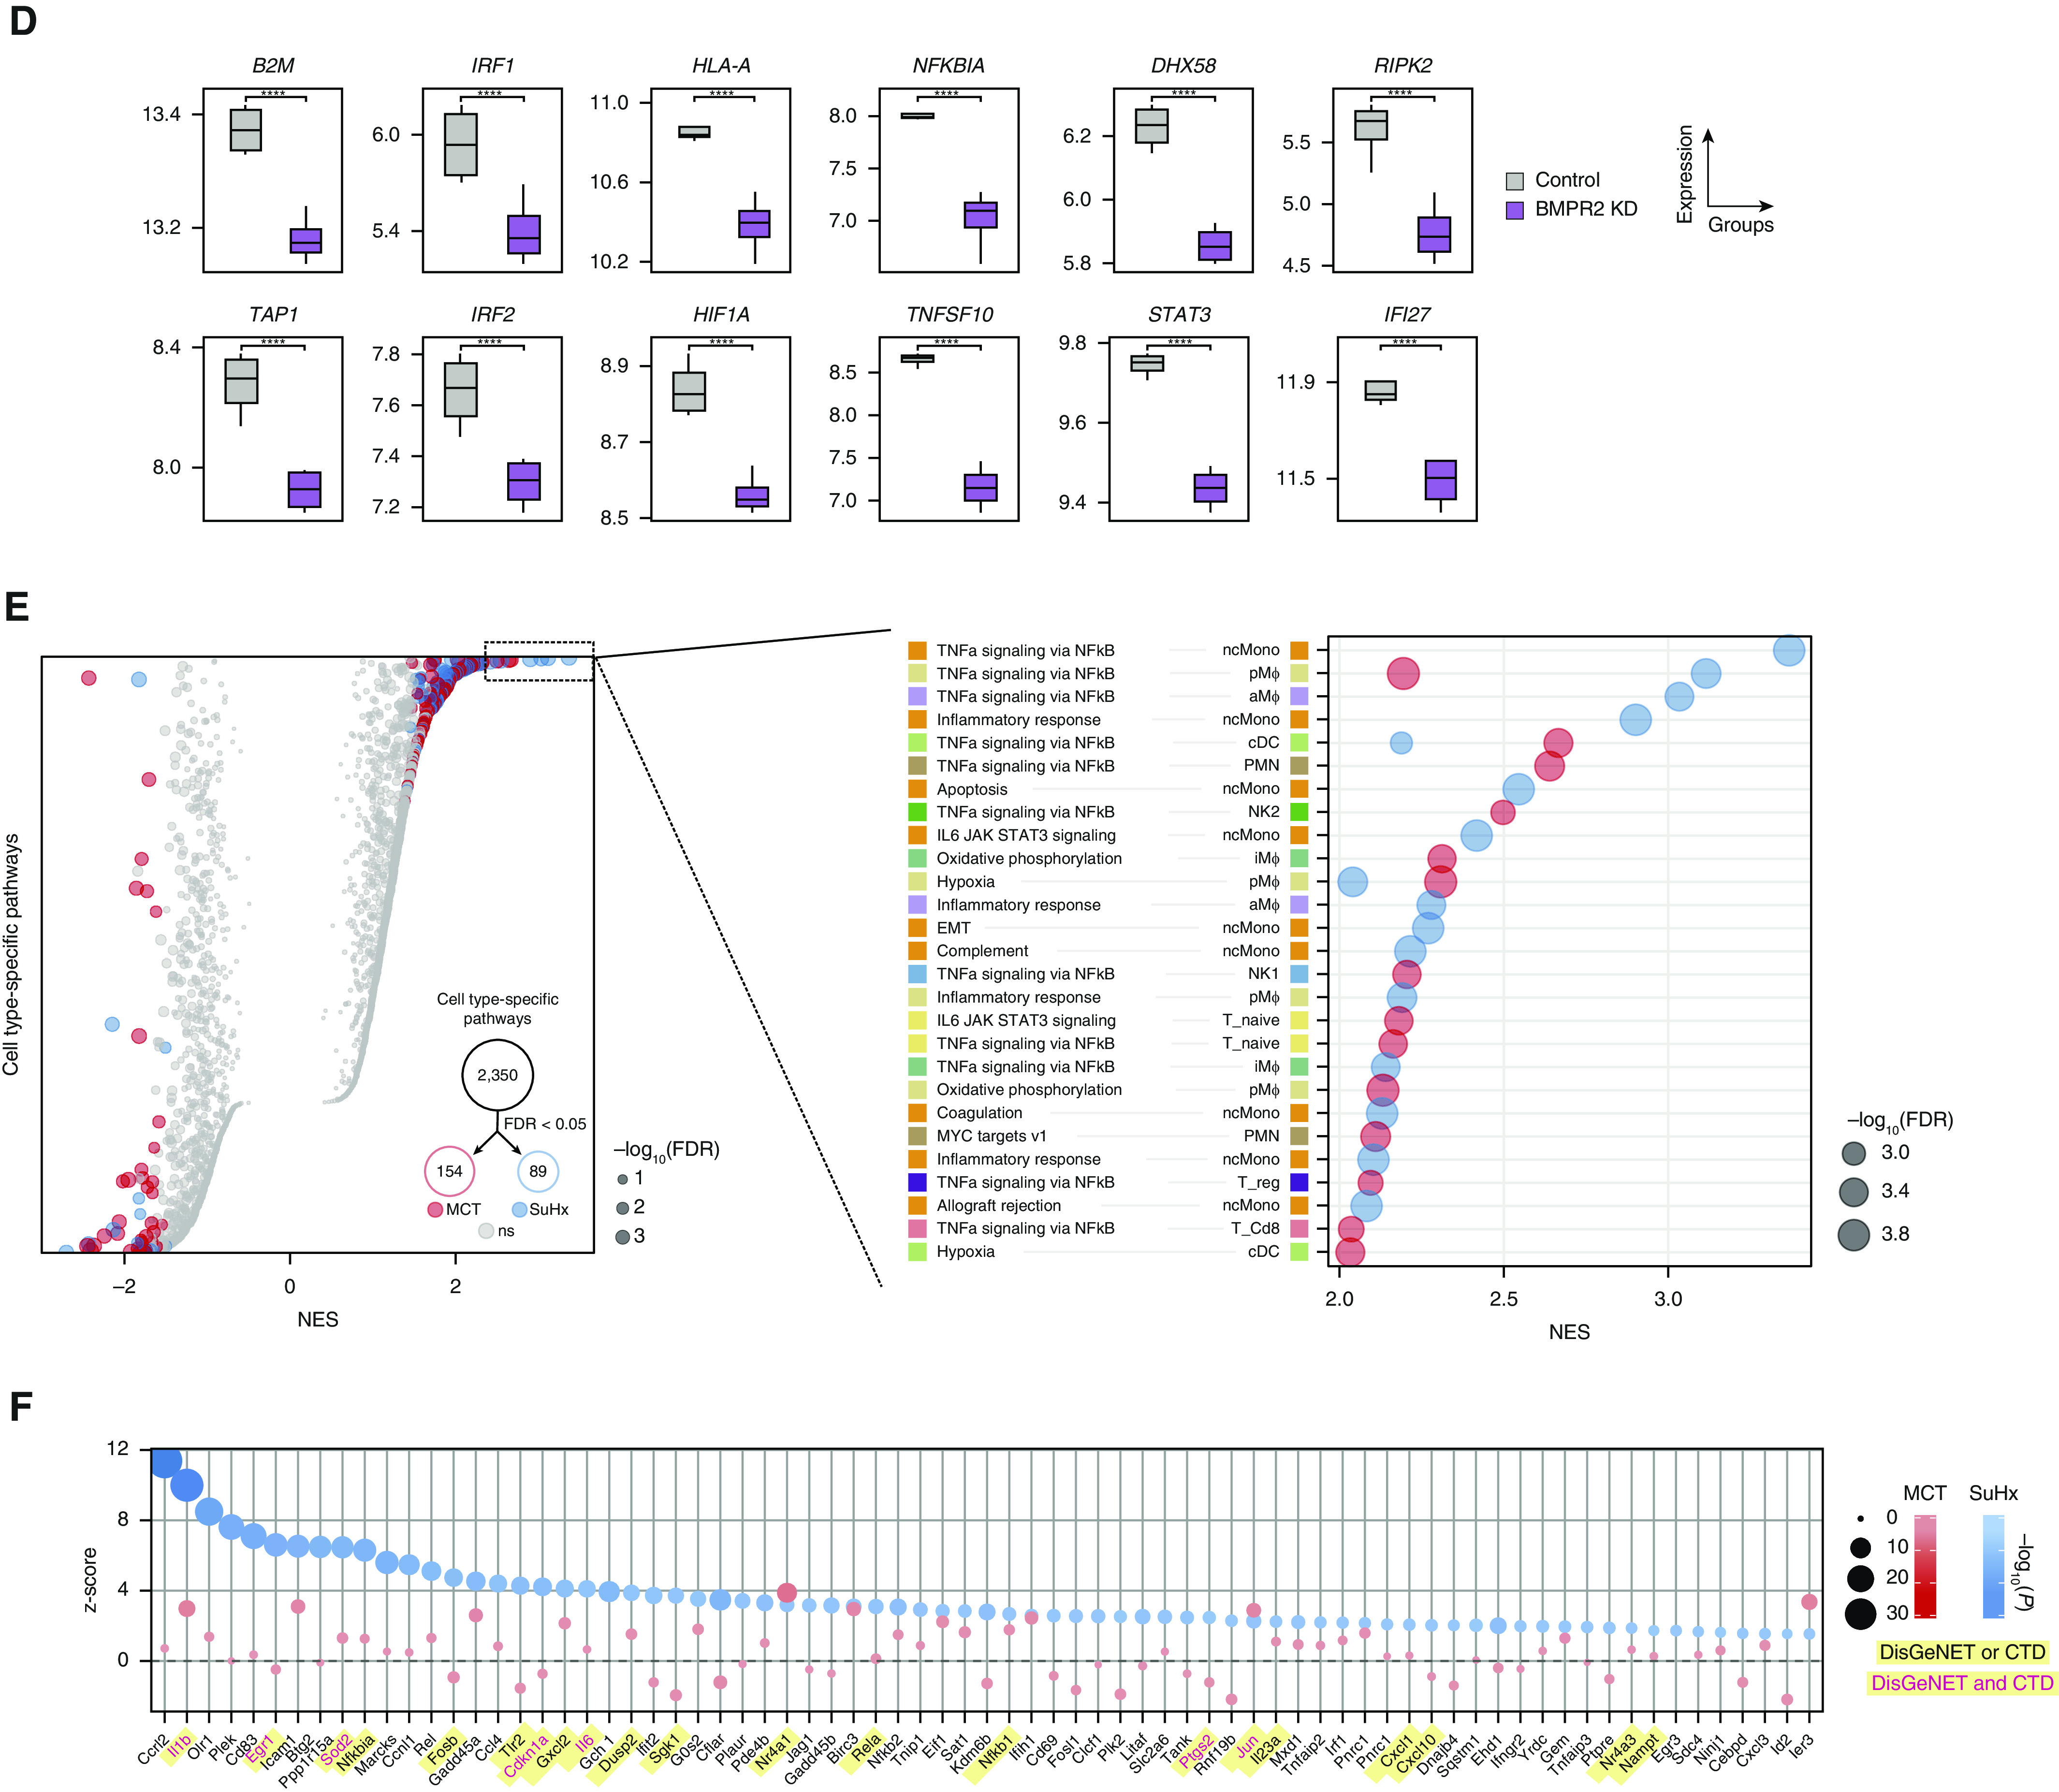
Figure 4.


Single-cell RNA sequencing reveals pathways in individual cell types of pulmonary arterial hypertension models. (A) Heatmap showing cell type–specific pathway enrichment of gene signatures of monocrotaline (MCT) (left) and Sugen-hypoxia (SuHx) (right) models compared with the control model using gene-set enrichment analysis (GSEA) (P < 0.05) and hallmark pathways from the Molecular Signatures Database on the y-axis. The dot size corresponds to −log10(P), and color represents the normalized enrichment score (NES) from GSEA, indicating upregulation (red) or downregulation (blue). TNFα/NF-κB signaling was significantly upregulated across many cell types in both disease models. (B) Dot plot showing NES of IFNα (black text) and IFNγ (green text) response pathways across cell types in the MCT (red) and SuHx (blue) models, in which the size and color tint of dots represent strength of −log10(P) values. A strong downregulation of IFN pathways was seen across cell types in the MCT model. (C) Dot plot showing MAST (Model-based Analysis of Single-Cell Transcriptomics) z-scores of leading-edge genes accounting for the MCT EA1 downregulation of IFNγ response as determined by GSEA from the MCT (red) and SuHx (blue) models, in which the size and color tint of dots represent the strength of −log10(P) values. Gene labels highlighted in yellow represent human pulmonary arterial hypertension–associated genes from either (black text) or both (red text) of the Comparative Toxicogenomics Database and DisGeNET databases. (D) Boxplots showing RNA expression of human orthologs of select IFN leading-edge genes shown in C derived from a public microarray (Gene Expression Omnibus series 70456) in which primary human pulmonary arterial endothelial cells were transfected with control (gray) or BMPR2 (purple) siRNA (n = 4/group from 4 donors). P values were determined by using the limma R package: ****False discovery rate (FDR) < 0.05. (E) Dot plots showing all (left) and top 30 (right) cell type–specific pathways in descending order on the y-axis by NES in which positive scores indicate upregulation. Red (MCT) and blue (SuHx) dots met the FDR < 0.05 criterion, and gray dots were not significant (ns). The dot size indicates the strength of the FDR. The number of significant cell type–specific rat signatures by disease model is shown in the lower right (FDR < 0.05). In the left plot, dots on opposite sides of an NES of 0 for a given row represent opposite directionalities of cell type–specific enrichment of MCT and SuHx models. Many more cell type–specific pathways were significant in the MCT model compared with the SuHx model, but TNFα/NF-κB signaling in SuHx nonclassical monocytes (ncMonos) was the most prominently upregulated pathway overall (right). Cell-type colors correspond to those as labeled in Figure 1B. (F) Dot plot showing MAST z-scores of leading-edge genes accounting for the SuHx ncMono upregulation of TNFα/NF-κB signaling with figure legend as described in C. CTD = Comparative Toxicogenomics Database; KD = knockdown; NK = natural killer.
