Figure 7.


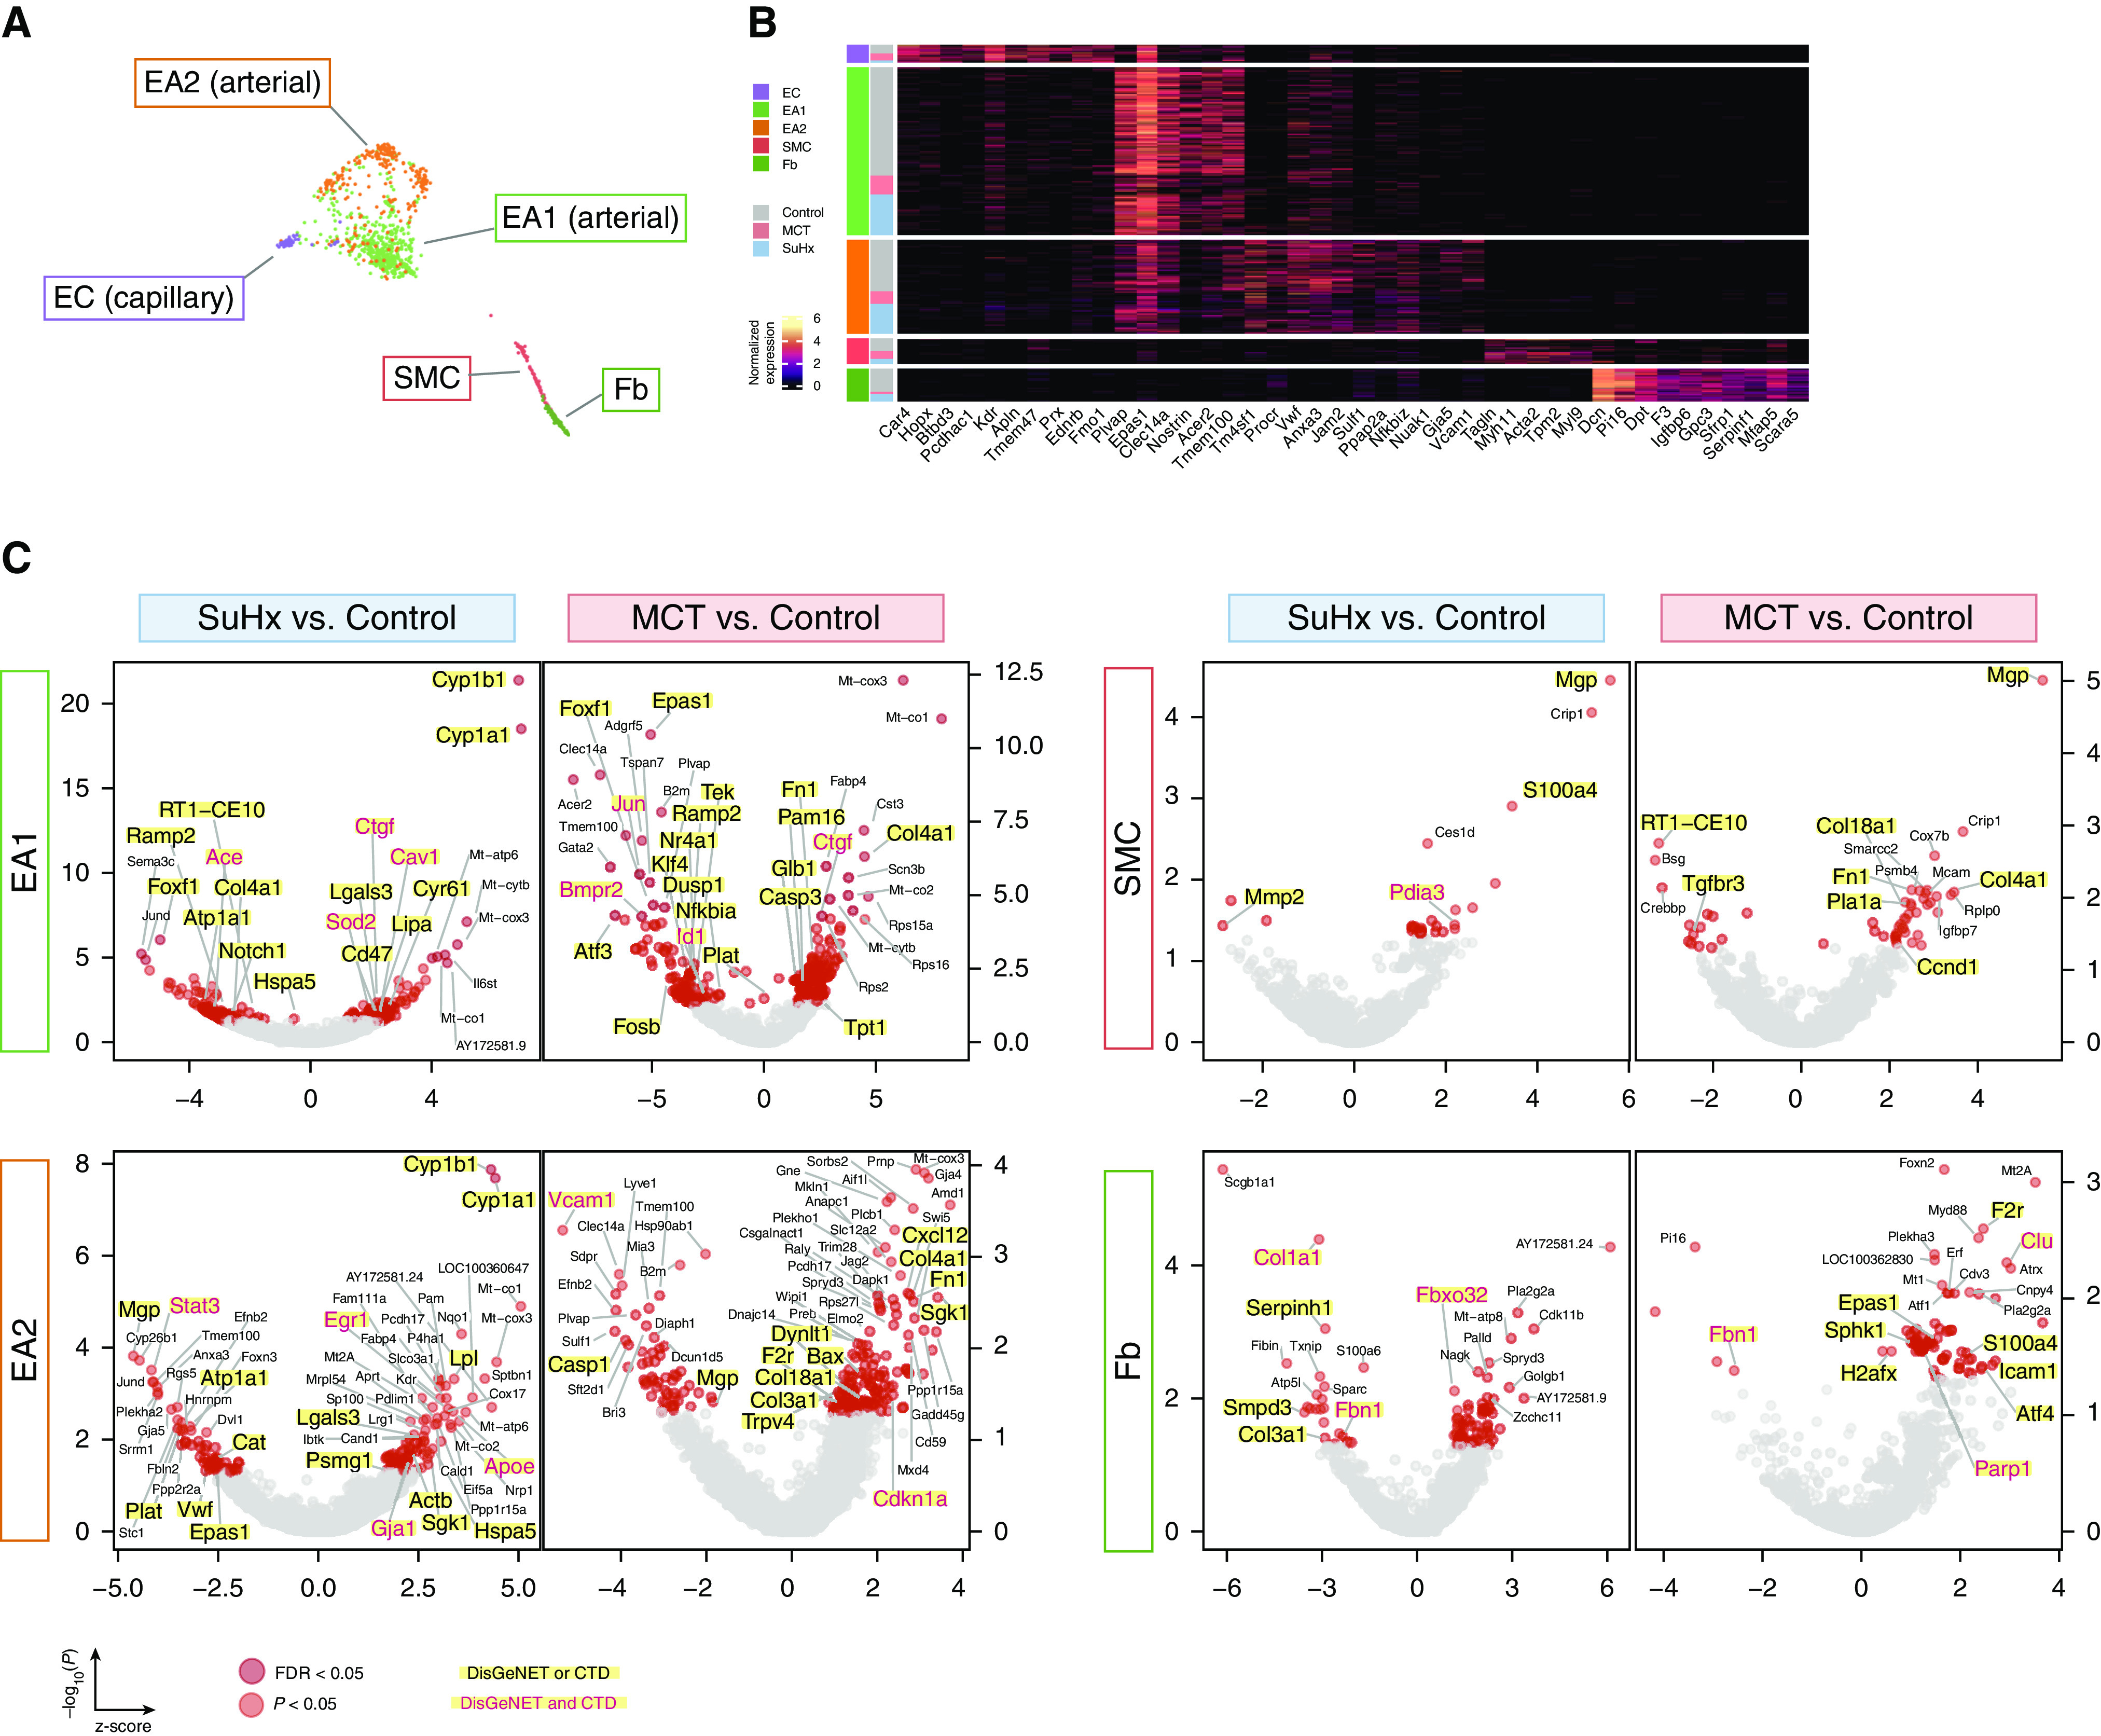
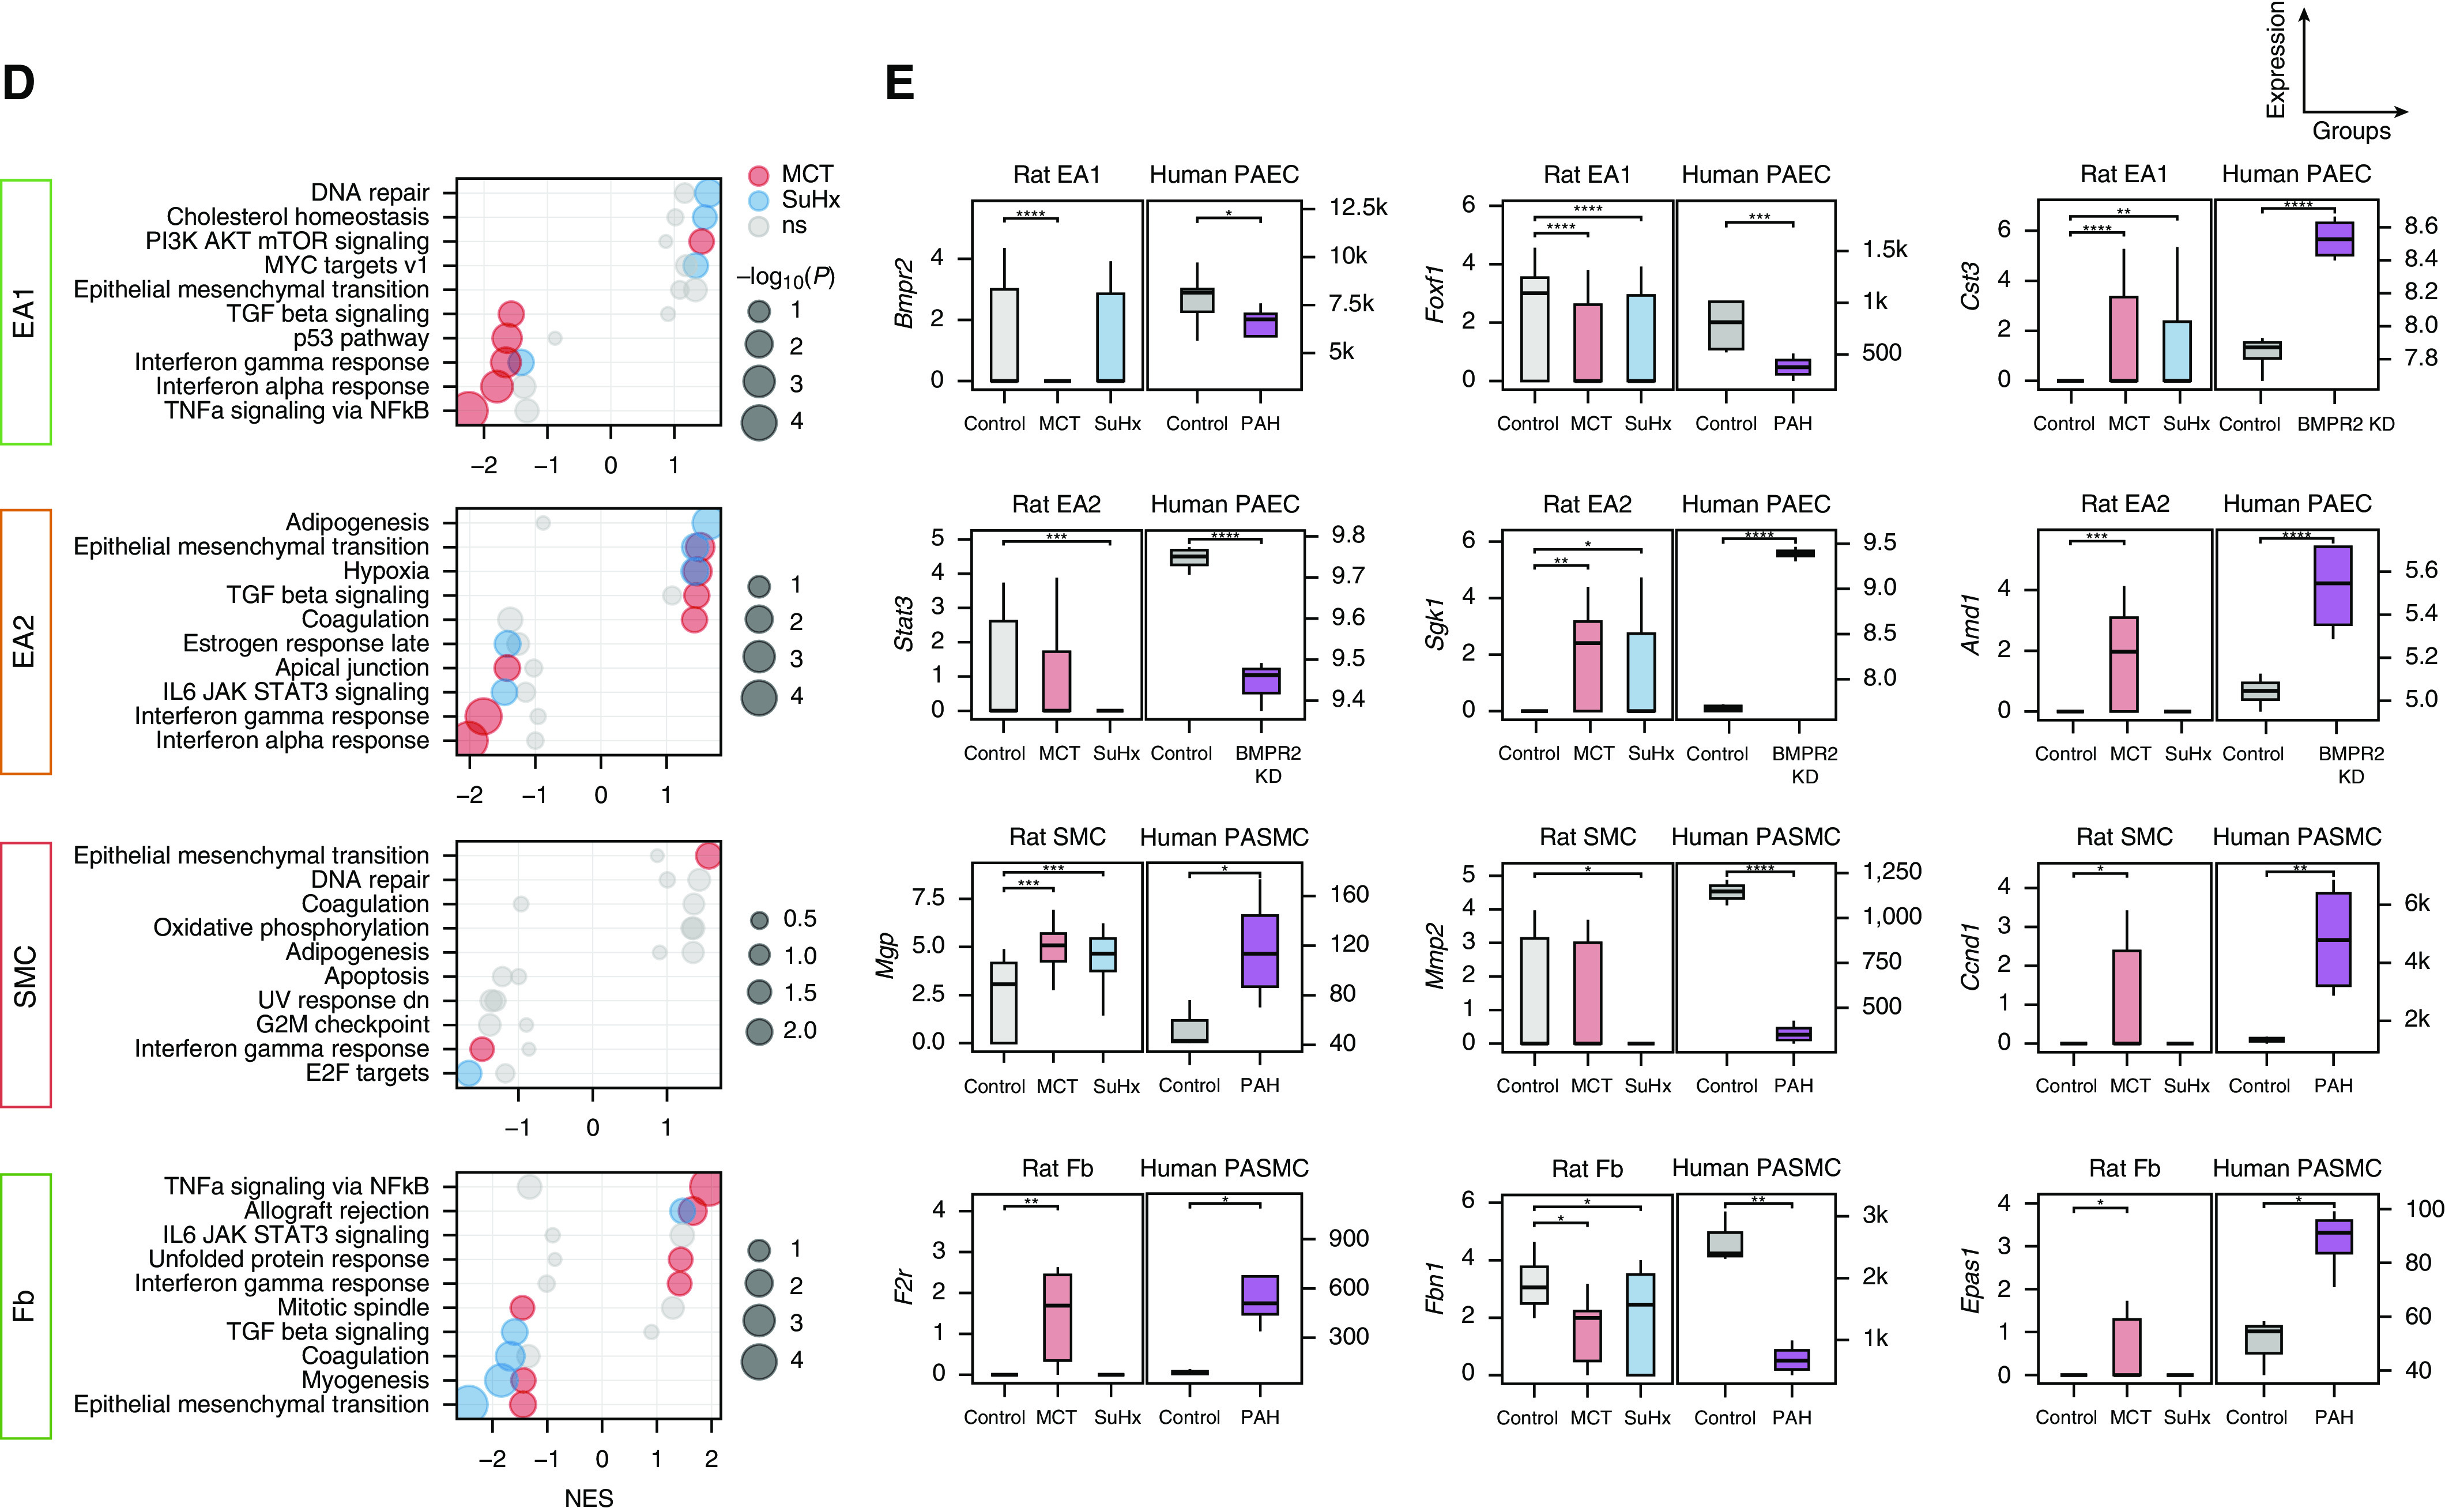
Single-cell RNA sequencing uncovers perturbations in lung vascular cell types relevant to human pulmonary arterial hypertension (PAH). (A) Uniform manifold approximation and projection plot showing vascular cells from 18 rat lungs with clusters labeled by cell type. (B) Heatmap showing normalized expression of top marker genes used to identify the vascular cell types, in which each row is an individual cell. Shown to the left are the condition and cell type to which each cell belongs. (C) Volcano plots showing differentially expressed genes (DEGs) within vascular cell types for the Sugen-hypoxia (SuHx) or monocrotaline (MCT) models versus the control model, in which the x-axis represents MAST (Model-based Analysis of Single-Cell Transcriptomics) z-scores and the y-axis indicates −log10(P). Significant upregulated (z > 0) or downregulated (z < 0) genes are shown as red (P < 0.05) or dark red (false discovery rate [FDR] < 0.05) dots. DEGs (P < 0.05) labeled and highlighted in yellow represent human PAH-associated genes from either (black text) or both (red text) of the CTD and DisGeNET databases. Otherwise, DEGs are labeled with their gene names if the FDR < 0.05 (endothelial arterial type 1 cell [EA1]) or P < 0.01 (EA2, SMC, Fb). (D) Dot plots showing the top five upregulated and top five downregulated pathways within vascular cell types as determined by gene-set enrichment analysis. Colored dots in red (MCT) or blue (SuHx) indicate significant values (P < 0.05), whereas gray dots represent values that were not significant (ns). The dot size corresponds to the −log10(P) value. (E) Box plots showing expression of select DEGs in rat lung vascular cell types with similar changes shown side by side in human orthologs from public cell type–specific expression data sets: BMPR2: Gene Expression Omnibus series (GSE) 126262, primary PAECs from two patients with PAH with BMPR2 mutations versus nine unused donor controls; FOXF1: GSE126262, primary PAECs from four male patients with PAH versus five male unused donor controls; CST3, STAT3, SGK1 and AMD1: GSE70456, four BMPR2 siRNA–transfected versus four control siRNA–transfected primary human PAECs from four donors; MGP, MMP2, CCND1, F2R, FBN1, and EPAS1: GSE2559, primary human PASMCs from two patients with PAH versus two normal subjects (n = 4 vs. 3, respectively, including BMP2-treated vs. untreated). P values from RNA sequencing (GSE126262) were determined by using DESeq2, whereas those from microarray (GSE70456 and GSE2559) were determined by using R limma: *P < 0.05, **P < 0.01, ***P < 0.001, and ****FDR < 0.05. CTD = Comparative Toxicogenomics Database; Fb = fibroblast; KD = knockdown; NES = normalized enrichment score; PAEC = pulmonary artery endothelial cell; PASMC = pulmonary arterial SMC; SMC = smooth muscle cell.
