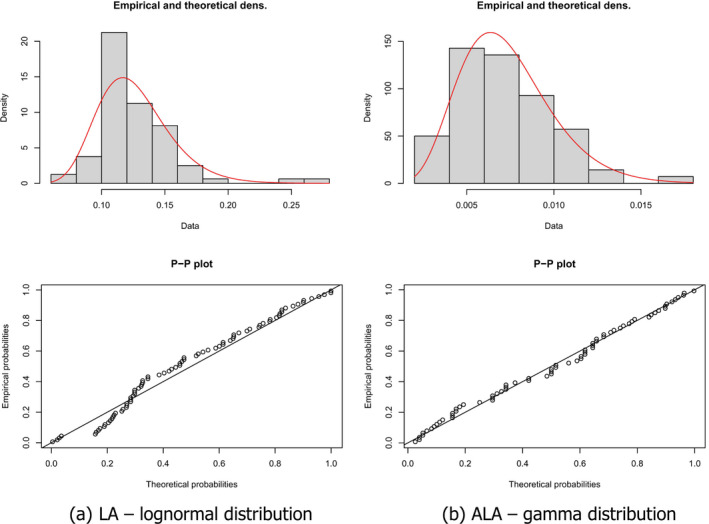
Figure 2.

Comparison of empirical distributions of (a) mean LA AT concentrations (given as proportion) with a theoretical lognormal distribution and (b) mean ALA AT concentrations (given as proportion) with a theoretical gamma distribution (density and P‐P plots, theoretical distribution represented as a red curve in the density graph)
