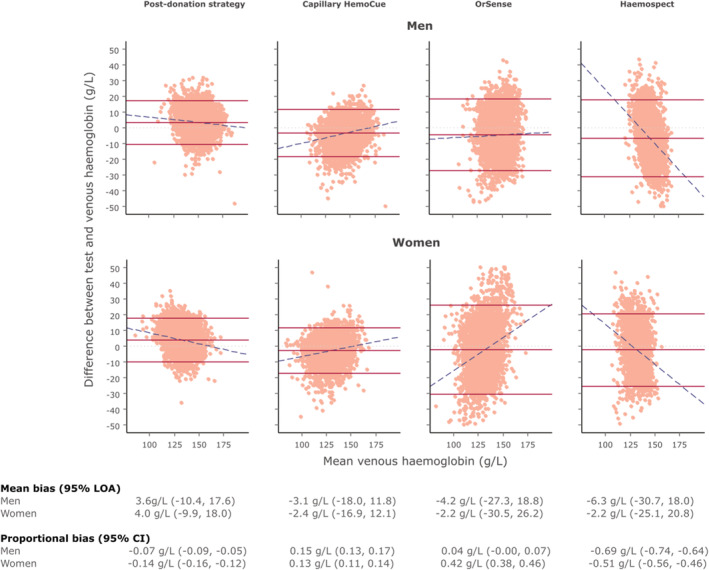
FIGURE 2.

Bland–Altman plot of each haemoglobin testing strategy by sex using venous haemoglobin values as the reference test. Note: Dotted light grey lines represent zero bias. Solid red lines represent the mean bias of the testing strategy (middle) and accompanying 95% limit of agreement (LOA; upper and lower) of the mean bias. Dashed blue lines depict proportional bias estimated using linear regression. Men—Post‐donation strategy: N = 5920, 4.3% outside the LOA. Capillary HemoCue: N = 5279, 5.1% outside the LOA. OrSense: N = 4861, 5.7% outside the LOA. Haemospect: N = 4352, 5.5% outside the LOA. Women ‐ Post‐donation strategy: N = 6394, 5.2% outside the LOA. Capillary HemoCue: N = 5724, 5.0% outside the LOA. OrSense: N = 5580, 5.2% outside the LOA. Haemospect: N = 4170, 5.5% outside the LOA [Color figure can be viewed at wileyonlinelibrary.com]
