FIGURE 3.

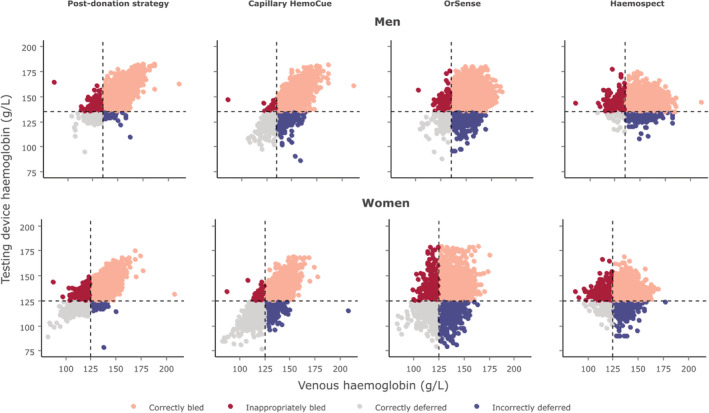
Scatterplot comparing testing device haemoglobin values to those obtained from venous blood samples by sex [Color figure can be viewed at wileyonlinelibrary.com]

Scatterplot comparing testing device haemoglobin values to those obtained from venous blood samples by sex [Color figure can be viewed at wileyonlinelibrary.com]