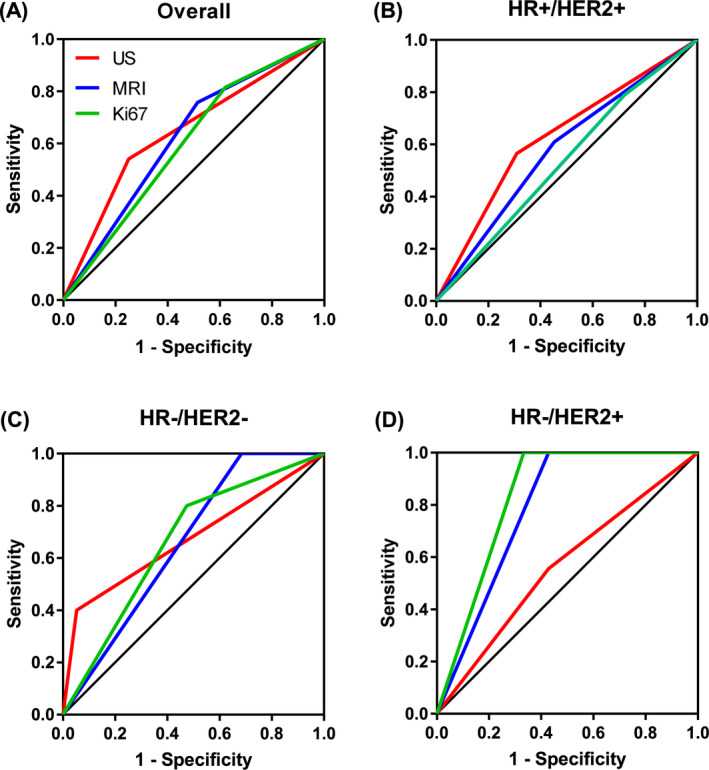
FIGURE 2.

ROC curves for detecting pCR by US, by MRI and by Ki‐67. Data are shown for all patients with MRI and US (A) and for patients with HR+/HER2+ (B), HR−/HER2− (C) and HR−/HER2+ (D) tumors. MRI and US data were available for 107 patients and Ki‐67 data were available for 86 patients. HER2, human epidermal growth factor receptor 2; HR, hormone receptor; MRI, magnetic resonance imaging; pCR, pathological complete response; ROC, receiver operating characteristic; US, ultrasound
