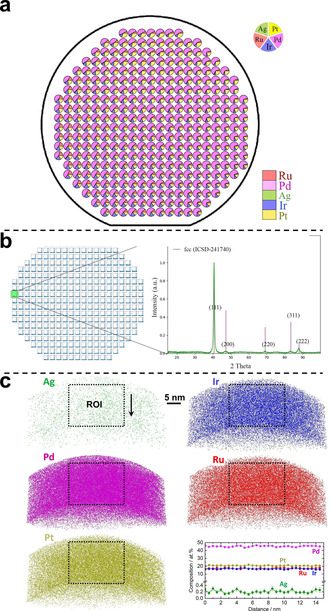
Figure 2.

Results of spatially resolved a) EDX measurements at each MA of ML2 illustrating the continuous composition gradients; b) XRD measurements of ML2 and a selected diffraction pattern of the MA Pd46Pt19.2Ru17.9Ir16.8Ag0.1; c) visualisation of APT results from a CSS thin film sputtered on a tip‐array [20] to confirm the single‐phase CSS state. The overall composition of this sample as determined by APT is Pd47.1Pt18.9Ru17.8Ir15.9Ag0.3.
