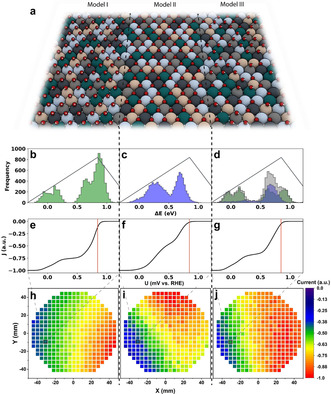
Figure 3.

Comparisons between models I, II and III. a) Schematic representation of how the CSS surface is populated in the models. Red atoms represent oxygen, white atoms represent hydrogen, and the other colours represent the CSS surface. b–d) Histograms showing the binding energy distribution patterns of *OH (green), *O (blue), and combined (grey) on the simulated 10 000 atom surface. Volcano curves illustrate the optimum binding energy. e–g) Example polarization curves for Ag4Ir16Pd30Pt14Ru36 plotted as a function of potential. Red lines indicate the potential 820 mV vs. RHE. h–j) Activity maps plotted using models I, II and III respectively. Current is calculated at 820 mV vs. RHE, compositions are taken from ML1. Selected compositions in (e–g) are indicated by the black box.
