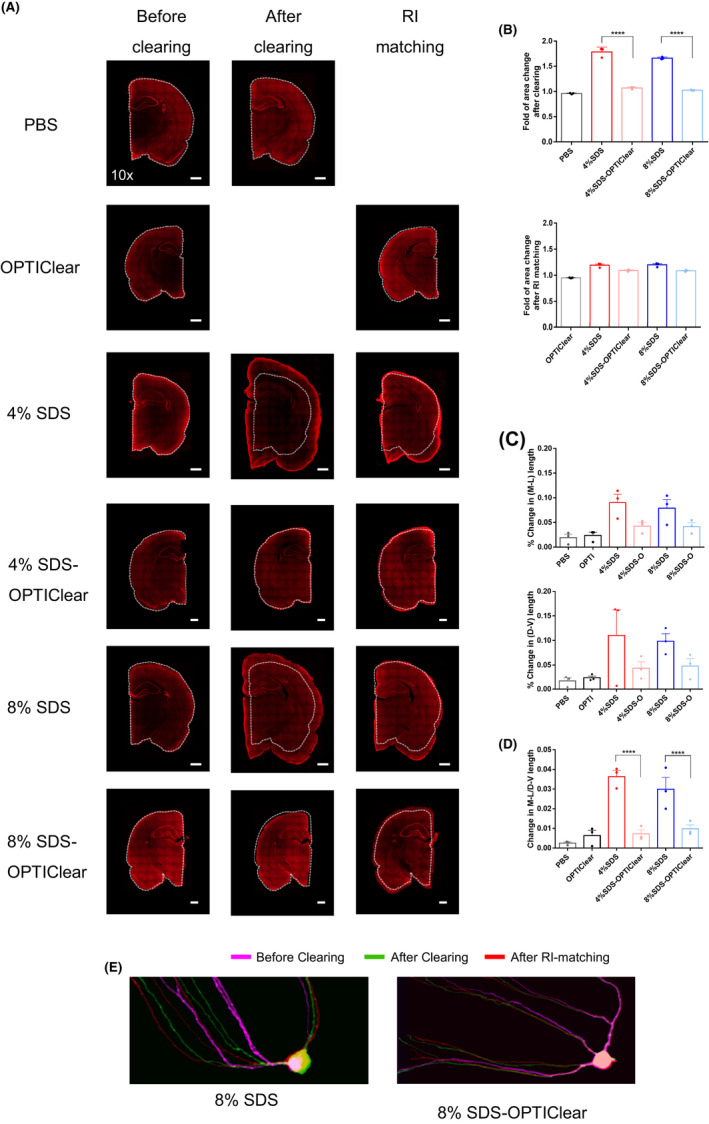
Figure 2.

Tissue distortion level after clearing with different conditions. 1 mm‐thick rat tissues were stained with TO‐PRO®‐3 and then imaged before delipidation, after delipidation and after RI‐matching in OPTIClear. (A) Representative images of TO‐PRO®‐3 stained tissues under different stages of clearing. White dotted lines marked the original boundary of tissues. Scale bars = 1 mm (n = 3). (B) Fold tissue area changes after tissue clearing and RI‐matching, respectively. (C) Percentage changes in dorsal–ventral (D‐V) and mediolateral (M‐L) lengths after RI‐matching respectively (n = 3). (D) Percentage changes in the ratio of D‐V and M‐L length after RI‐matching (n = 3). (E) Merged images of GFP‐labelled hippocampal neurons under different stages of clearing. The same neuron was imaged before and after clearing, and after RI‐matching. Images were labelled with different colours (see Fig. S3 and merged together. Higher degree of overlapping indicates lower distortion level in morphology. Scale bars = 20 µm. Mean ±S.E.M. for all graphs. Two‐way ANOVA, Tukey's multiple comparison test, *p ≤ 0.05, **p ≤ 0.01, ***p ≤ 0.001, ****p ≤ 0.0001
