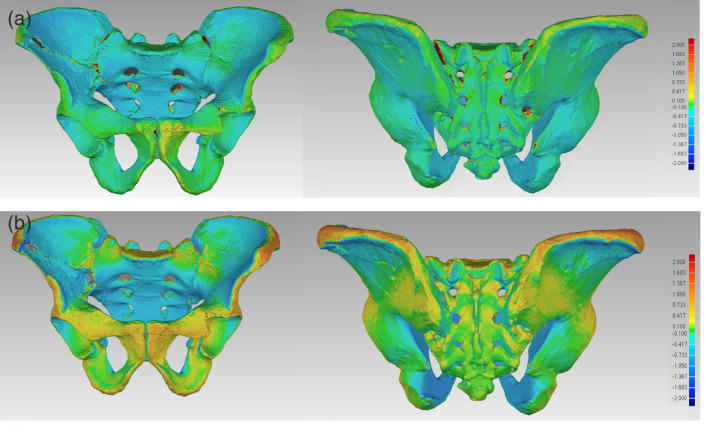
FIGURE 2.

(a) Differences between the pelvic surfaces extracted from a clinical CT scan and photogrammetry, visualized as a color map. (b) Differences between the pelvic surfaces extracted from a clinical scan and 3D structured light scanner. A positive deviation indicates that the mesh obtained by surface scanning or photogrammetry is larger than the mesh obtained by CT scanning (yellow to red colored areas). In areas with a negative deviation, the photogrammetric or surface scanned mesh is smaller than the reference mesh of CT scanning (blue). If the surface differences were smaller than 100 μm, we defined these differences as non‐relevant deviations between the methods. (green areas)
