FIGURE 3.

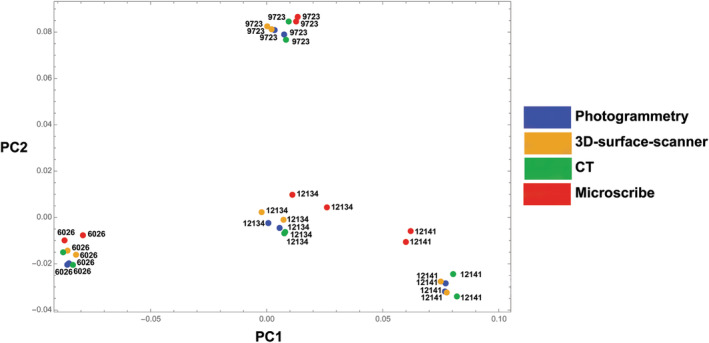
Principal component analysis (PCA). The first two PCs account for 67% of the total shape variance. The colors of the dots represent the scanning methods and the labels indicate the four different specimens

Principal component analysis (PCA). The first two PCs account for 67% of the total shape variance. The colors of the dots represent the scanning methods and the labels indicate the four different specimens