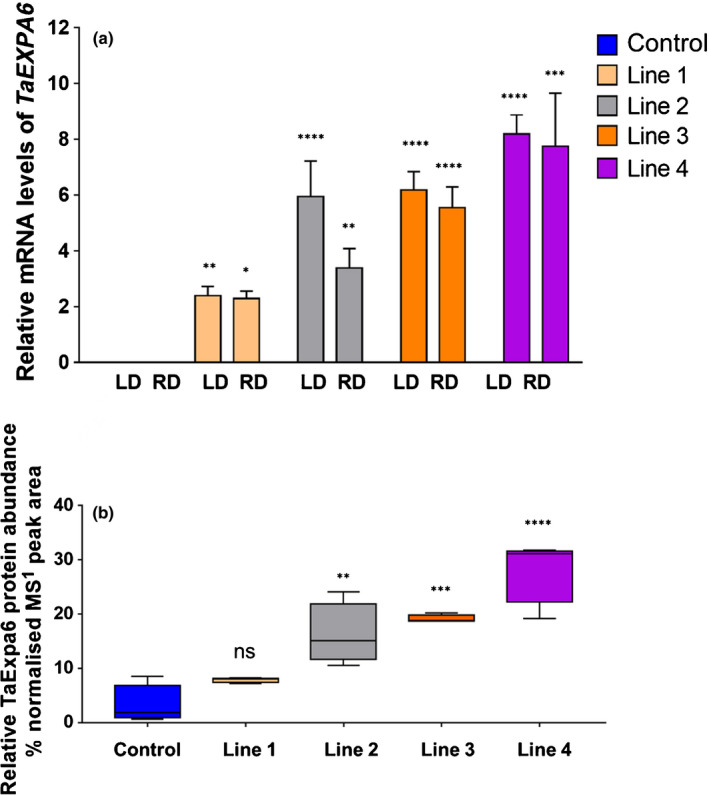
Fig. 3.

Expression and protein abundance of TaExpA6 in grains. Control line corresponds to spring wheat cv Fielder that has undergone the same tissue culture process as the transformed lines. (a) Relative messenger RNA (mRNA) levels of the TaExpA6 transgene assessed by quantitative reverse transcription PCR in grains at 15 d after anthesis (DAA) in the control and transformed lines 1, 2, 3 and 4 from experiment with low density (LD) and regular density (RD) planting. (b) Relative protein abundance as assessed by LC–MS/MS analysis at 15 DAA in the control and transgenic lines 1, 2, 3 and 4 at regular agronomical plant density. Asterisks indicate significant differences by pairwise comparisons between each line and the control (Fisher’s least significant difference test post hoc): *, P < 0.10; **, P < 0.05; ***, P < 0.01; ****, P < 0.001; ns, not significant. All data are shown as mean and SE.
