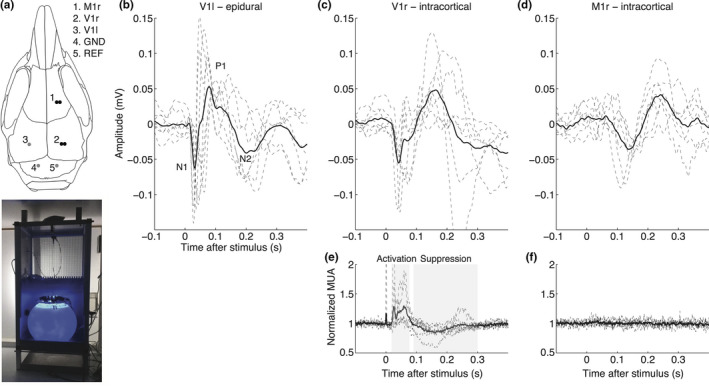
Figure 1.

Approach and validation of single‐flash visual evoked potential measurements in freely behaving wild‐type mice. (a) Top: Electrode locations used for EEG (single epidural electrode in left V1; grey dot), or local field potential/neuronal multi‐unit activity (bipolar intracortical electrodes in right V1 and M1; black dots) recordings. Bottom: Home cage with light sphere (cf. van Diepen et al., 2013 for details) for housing a mouse during VEP recordings. (b–f) Individual (dashed lines) and group‐averaged (thick line) responses to 100 single flashes (presented at 1 Hz, 1 V) in visual and motor cortex. (b) EEG network responses recorded epidurally over the left visual cortex (n = 8) showing N1, P1, and N2 responses. (c) Local field potential (n = 6) and (e) baseline normalized multi‐unit activity (n = 6) recorded in the right visual cortex with activation between 20 and 80 ms, and transient suppression of activity between 90 and 300 ms. (d) local field potential and (f) normalized multi‐unit activity in the right motor cortex. Note the absence of time‐locked neuronal (multi‐unit) activity in relation to light stimulation in the motor cortex. MUA: multi‐unit activity; r = right; l = left; GND = ground; REF = reference
