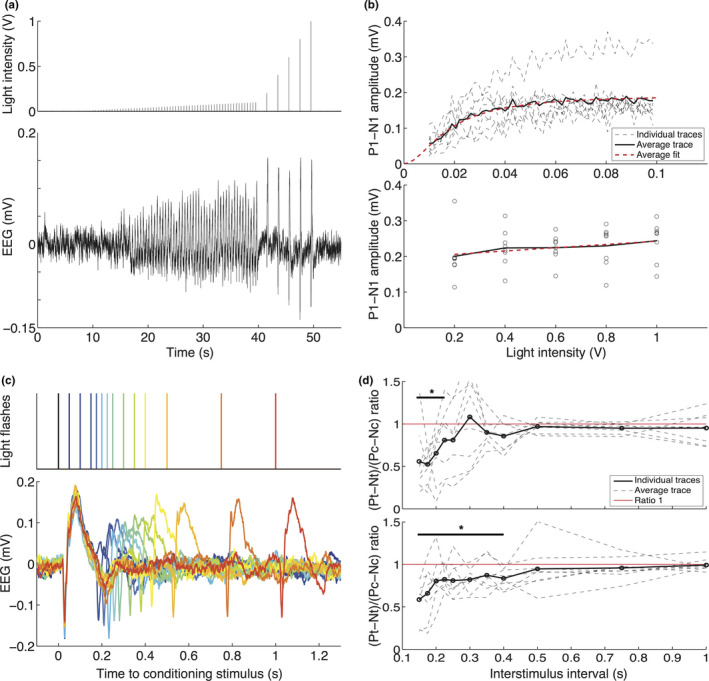
Figure 2.

Visual evoked potential responses in freely behaving wild‐type mice show light intensity dependency with a plateau that is stable across animals, and show light‐intensity dependent recovery in a paired‐pulse paradigm after 225 or 500 ms. (a) Top: Light flash stimulation protocol used for generating input‐output curves, consisting of 60 flashes between 0.01 and 0.1 V at 2 Hz and five flashes between 0.2 and 1 V at 0.5 Hz. Bottom: Example EEG trace showing VEP responses to increasing stimulation intensity, illustrating increasing N1‐P1 peaks up to 0.1‐V stimulation intensity, reaching a plateau between 0.2‐ and 1‐V intensity. (b) Individual (dashed black line) and averaged (thick black line) P1‐N1 peak amplitudes for each light intensity. Top: For stimulation between 0.01‐ and 0.1‐V stimulation intensity; bottom: for stimulation between 0.2 and 1 V, with fitted Naka‐Rushton (top; dashed red line) and least‐squares linear regression lines (bottom). (c) Top: Paired light flashes were presented at 13 intervals after the conditioning stimulus (black), from blue to red: 50, 100, 150, 175, 200, 225, 250, 300, 350, 400, 500, 750, and 1,000 ms. Bottom: Example EEG traces per interval using the same color coding. (d) Top: For 0.1‐V stimulation voltage, individual (dashed black) and averaged (thick black line) ratio of P1‐N1 peak amplitudes in response to a test (Pt‐Nt) and conditioning stimulus (Pc‐Nc). Red line indicates a ratio of 1 at which the test stimulus amplitude equals that of the conditioning stimulus. Recovery of responses is present after 225 ms (difference not significant from 1). Bottom: Similar paired‐pulse response ratios shown for stimulation at 1 V, showing full recovery of the test response to that of the conditioning response at 500 ms
