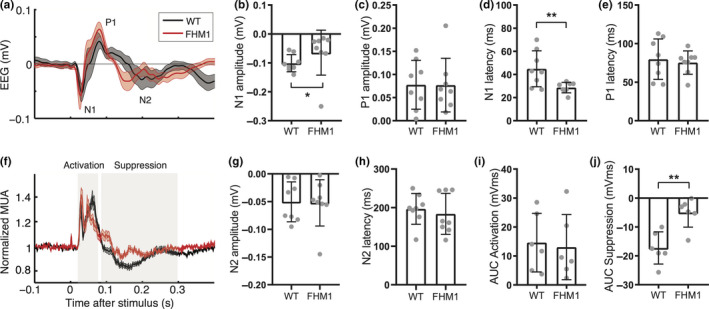
Figure 3.

Single‐flash VEP responses differ between familial hemiplegic migraine type 1 (FHM1) mutant and wild‐type (WT) mice. (a) Average traces (mean with the shaded standard error of the mean) of epidural recordings over the visual cortex in WT (black) and FHM1 (red) mice. (b–e) Individual and mean amplitude and latency for N1 and P1 peaks (n = 8 mice per group). (b) N1 amplitude is smaller in FHM1 (significance indicated: *p = .04). (c) P1 amplitude is similar. (d) N1 latency is shorter in FHM1 (**p = .01). (e) P1 latency is similar. (f) Average traces of intracortical neuronal MUA recordings over the visual cortex of WT (black) and FHM1 (red) mice. (g, h) Individual and mean amplitude and latency for N2 peak (n = 8 mice per group). (g) N2 amplitude is similar. (h) N2 latency is similar. (i, j) Individual and mean area‐under‐curve (AUC) for two phases of the neuronal response to visual stimulation (n = 6 mice per group). (i) AUC for initial activation (between 20 and 80 ms) is similar between groups. (j) AUC for suppression (between 90 and 300 ms) is smaller in FHM1 mice (**p = .01). Error bars in B‐E and G‐J show standard deviation
