Figure 5.

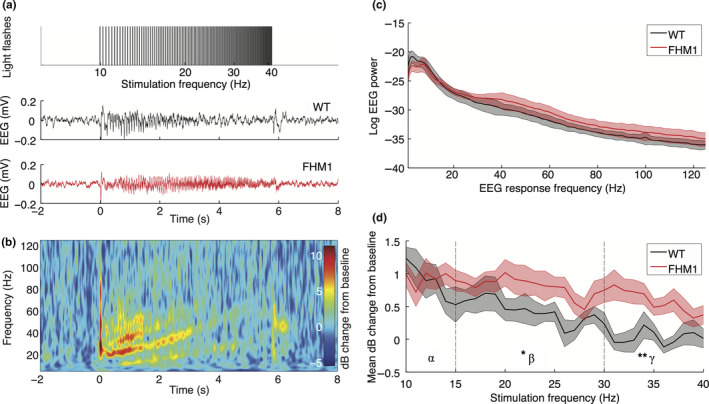
Chirp‐stimulation‐induced “photic drive” is more pronounced in the EEG beta‐gamma bands of the visual cortex in familial hemiplegic migraine type 1 (FHM1) mutant compared to wild‐type (WT) mice. (a) Top: Stimulation at increasing frequencies between 10 and 40 Hz in 1‐Hz steps, with four light flashes per frequency, is used to generate a chirp stimulation of ~6 s. Example traces of the averaged EEG response to the chirp stimulation paradigm of a WT (middle) and a mutant (bottom) animal. (b) Time‐frequency domain representation of averaged and baseline‐corrected EEG responses of the WT example trace. Baseline correction was performed over the averaged trials by calculating the log10 decibel (dB) change with respect to EEG activity 160 to 10 ms prior to stimulation onset. Note the presence of higher‐order responses, especially the second harmonic (20 to 80 Hz), up to halfway the chirp stimulation at 3 s. (c) Power spectral density of the non‐baseline‐normalized EEG response power, showing similar EEG spectra for WT and mutant mice. (d) Averaged EEG response power between 5 and 125 Hz for each stimulation frequency is enhanced in mutant mice in the gamma band (30–40 Hz) compared to WT mice but not in the alpha (10–15 Hz) and beta (15–30 Hz) bands (significance indicated: **p = .028). EEG response power at the driving frequencies in the beta band is enhanced for mutant mice in the beta band (*p = .028), whereas response power at driving and 2nd harmonic frequencies is increased in the gamma band (driving: p = .021; 2nd harmonics: p = .038; see text for details)
