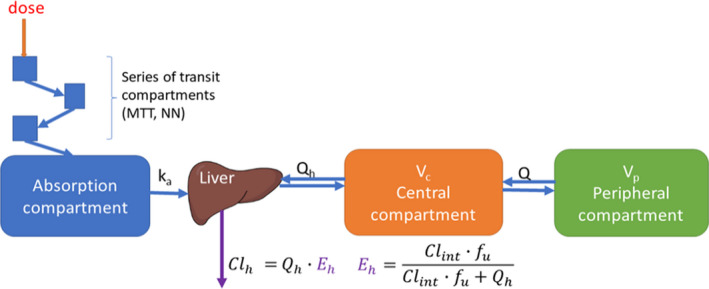
Figure 2.

Schematic representation of the pharmacokinetic model of both efavirenz and isoniazid. The absorption is described with a series of transit‐compartment to capture the delay in absorption, and a rate constant K a. The hepatic extraction (Eh) is responsible for both first‐pass metabolism and the systemic elimination with first‐order kinetics. V c represents the volume of distribution in the central compartment. Drug transfer between the central and peripheral compartment is defined by intercompartmental clearance Q/F, were F represents the oral bioavailability. [Colour figure can be viewed at wileyonlinelibrary.com]
