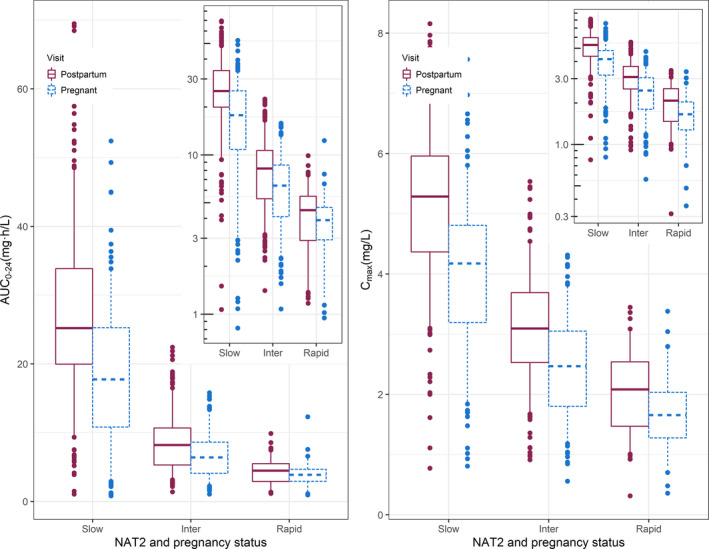
Figure 3.

Isoniazid exposures stratified by NAT2 genotype and pregnancy. The box plot (with box representing median and interquartile range and whiskers the 5th‐95th interval) summarizes isoniazid maximum concentration (Cmax) on the right and 0–24‐hour area under the concentration‐time curve (AUC0–24) on the left for the three genotypes (slow, intermediate, and rapid acetylator) for both the antepartum (red solid line) and postpartum (blue dashed lines) visit. AUC0–24 was calculated by integrating between the 0 and 24 hours after dosing time points. The inset panel shows the same values on the log‐scale. [Colour figure can be viewed at wileyonlinelibrary.com]
