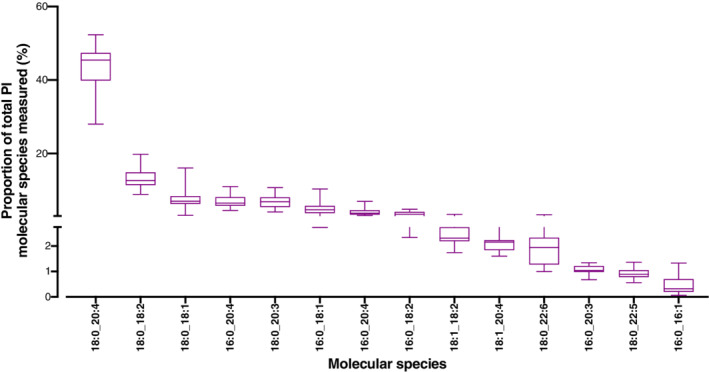
Fig 3.

Plasma phosphatidylinositol molecular species composition. Values are proportions in descending order of individual molecular species for n = 20 participants (men plus women, n = 10 per sex). Data points represent individual participants. Bar = mean (range). O,sn‐1 alkyl,sn‐2 ester species; P,sn‐1 alkenyl,sn‐2 ester species
