FIGURE 2.

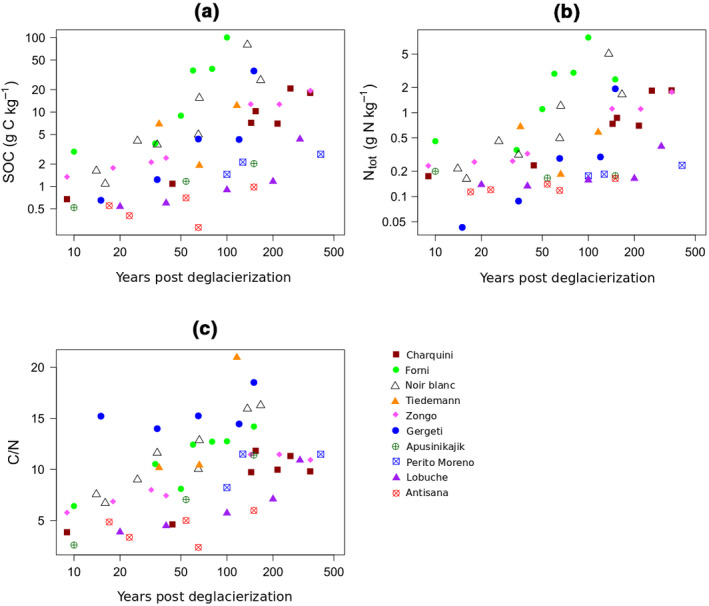
Plots of (a) soil organic carbon (SOC) concentration, (b) total N (Ntot) concentration, and (c) C/N ratio of topsoil samples versus time for the 10 soil chronosequences

Plots of (a) soil organic carbon (SOC) concentration, (b) total N (Ntot) concentration, and (c) C/N ratio of topsoil samples versus time for the 10 soil chronosequences