
FIGURE 4.
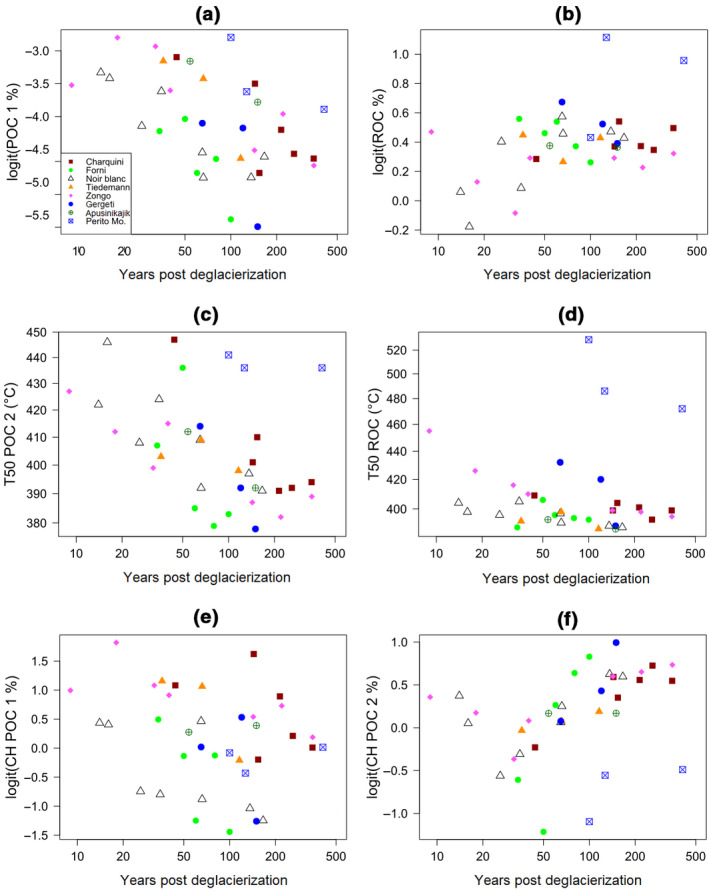
Relationships between soil age and (a) POC 1 (% of total SOC), (b) ROC (% of total SOC), (c) T50‐POC 2, (d) T50‐ROC, (e) CH‐POC 1 index, and (f) CH‐POC 2 index for eight proglacial soil chronosequences. CH, hydrocarbon effluents; POC, pyrolyzable organic carbon; SOC, soil organic carbon