
Figure 7.
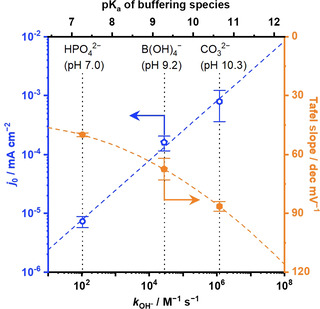
A trade‐off relationship between the exchange current density j 0 and the Tafel slope. Exchange current density j 0 and Tafel slope over the IrOx disk electrode in a RDE configuration are plotted as a function of the rate constants k OH− and corresponding pKa values in Equation (29), which were recorded in 1.0 mol kg−1 electrolyte solutions at a scan rate of −1 mV s−1 and a reaction temperature of 298 K, adopted from data in Figures S9 and S13.