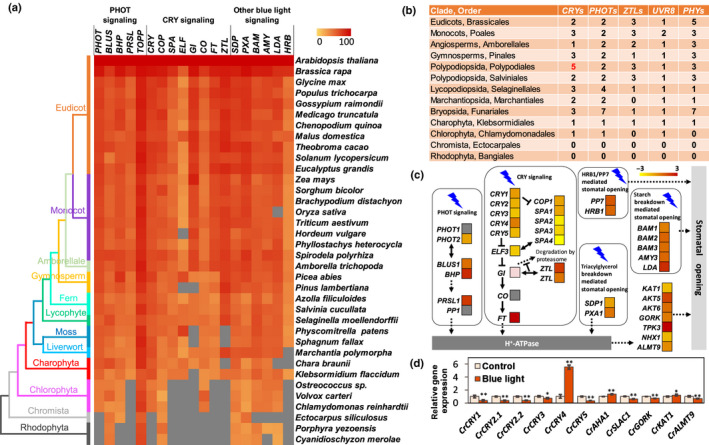
Fig. 3.

Comparative genomics and transcriptome analysis of the blue‐light signaling pathway. (a) Similarity heat map of blue‐light‐responsive protein families in different plant and algal species. Colored squares indicate protein sequence similarity from zero (yellow) to 100% (red); gray indicates no match of sequences in this species. (b) Number of photoreceptors in the major land plant and algal lineages. Arabidopsis thaliana, Oryza sativa, Amborella trichopoda, Tsuga heterophylla, Adiantum capillus‐veneris, Azolla filiculoides, Selaginella moellendorffii, Marchantia paleacea, Physcomitrella patens, Klebsormidium flaccidum, Chlamydomonas reinhardtii, Ectocarpus siliculosus and Porphyra yezoensis were representative species in each order. The number of cryptochromes (CRYs) in Adiantum capillus‐veneri is marked in red. (c) Transcriptome of differentially expressed genes (DEGs) of epidermal layers of the fern Nephrolepis exaltata in the key blue‐light signaling pathways (based on Arabidopsis) in response to 100 μmol m−2 s−1 blue light. (d) Gene expression of cryptochromes (CRYs) in response to blue light in the fern Ceratopteris richardii. Data are the average of three biological replicates and three technical replicates, and the error bars represent SD. *, P < 0.05; **, P < 0.01.
