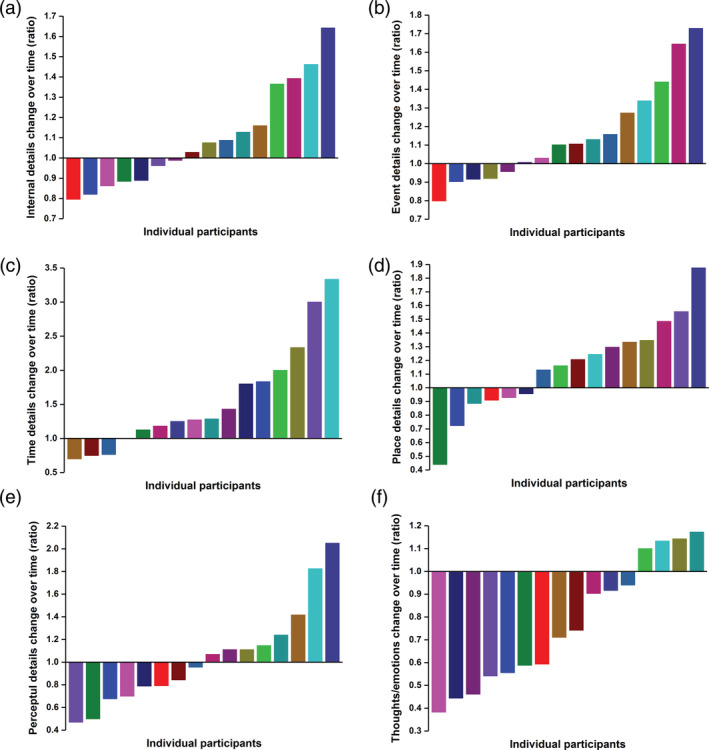
FIGURE 3.

Time‐dependent changes in the amount of autobiographical memory details produced after an 8‐month delay for each participant. Each participant is consistently represented by a unique color across all graphs. A ratio of one indicates a participant produced the same amount of details during both visits, a ratio above one indicates more detail was produced during the second visit, while a ratio below one indicates a decline in the amount of details over the 8‐month period. Ratios for each participant are ordered from lowest to highest in each graph to facilitate a clear interpretation of the distribution of scores across the group. Panel (a) represents total internal details, while panels (b–f) display the memory recall changes within each subcategory of internal details [Color figure can be viewed at wileyonlinelibrary.com]
