
FIGURE 4.
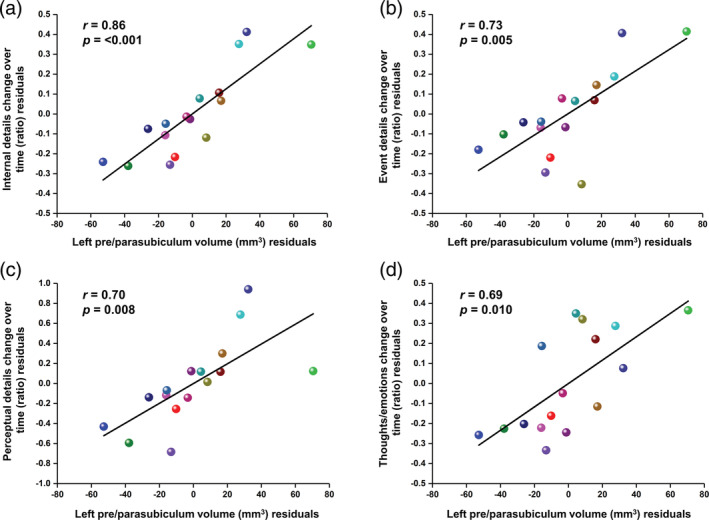
Partial correlation plots showing the association between the left pre/parasubiculum volume and time‐dependent changes in the amount of autobiographical memory details produced. Total internal details are plotted in (a), followed by event details (b), perceptual details (c) and thoughts and emotions (d). The plotted values represent the correlation between the residuals of the change in memory details over time and the residuals of the pre/parasubiculum volume after controlling for age, gender and total hippocampal volume, and are centered around zero. Each participant is represented by the same color as that displayed in Figure 3 [Color figure can be viewed at wileyonlinelibrary.com]