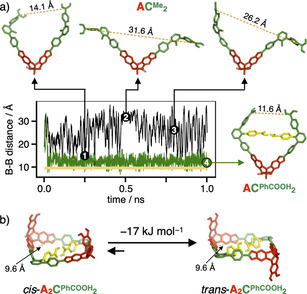
Figure 4.

a) Molecular dynamics calculations of ACMe 2 (black) and ACPhCOOH 2 (green) for 1 ns at 298 K (1–3 display structures for ACMe 2 at 250, 500 and 800 ps, 4 displays structure for ACPhCOOH 2 at 1 ns; yellow dashed lines indicate the B‐B distance for the free boronic acids, the yellow line in the graph indicates the B‐B distance in macrocyclic A2CPhCOOH 2); b) equilibrium between cis‐ and trans‐A2CPhCOOH 2 (structures and electronic energies derived from DFT calculations, H atoms are omitted for clarity).
