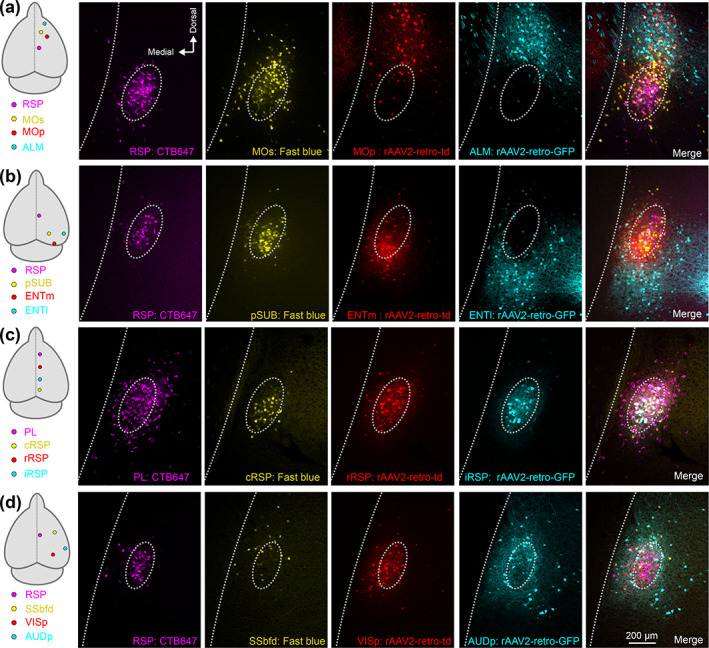
FIGURE 4.

Diverse spatial domains of claustrocortical pathways. Four color tracing was performed in several sets of cortical injection configurations, four of which are shown (a–d). (a) Retrograde labeling in the claustrum following injections into the cortical regions indicated on the left (RSP, MOs, MOp, and ALM). The dashed oval is provided for visual alignment to the CLARSP pathway across all single channels and the merged image (far right). (b–d) The same as (a), for experiments with retrograde tracers targeting different areas of the temporal lobe (b), frontal‐midline cortex (c), and sensory cortex (d). Data from other tracer combinations can be found in Tables 1 and 2 [Color figure can be viewed at wileyonlinelibrary.com]
