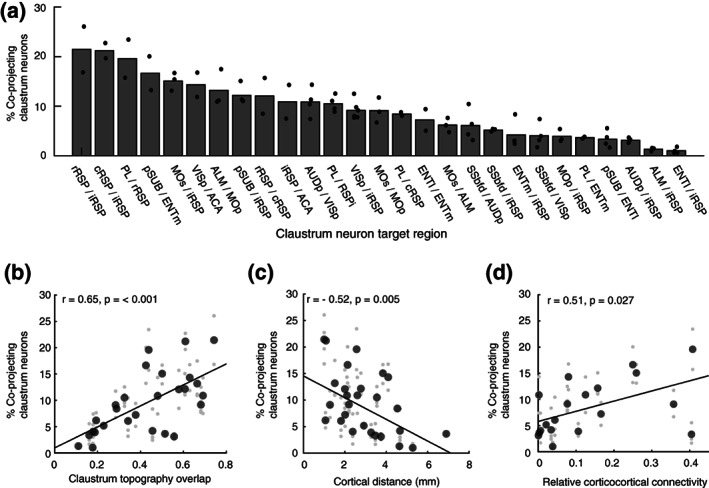
FIGURE 10.

Claustrum projections provide common input to neighboring and connected cortical regions. (a) The sorted claustrocortical co‐projection rate for all pairs of pathways measured. (b) The correlation between the spatial overlap of claustrocortical modules, and the percentage of co‐projecting neurons for each pair of claustrocortical pathways. The spatial overlap between claustrum modules was calculated by dividing the area jointly occupied by both pathways by the sum total of both individual pathways. (c) The correlation between co‐projection rate and the distance between cortical injection sites. (d) The correlation between co‐projection rate and the average (bidirectional) connectivity between each pair of cortical regions. Cortical connectivity was estimated using the data from the Allen brain institute (Oh et al., 2014). The large individual points in (b–d) indicate the grand mean across all mice for a given pair of pathways, and small gray points indicate experimental replicates. Correlation coefficients were calculated on the grand mean for each pair of pathways
