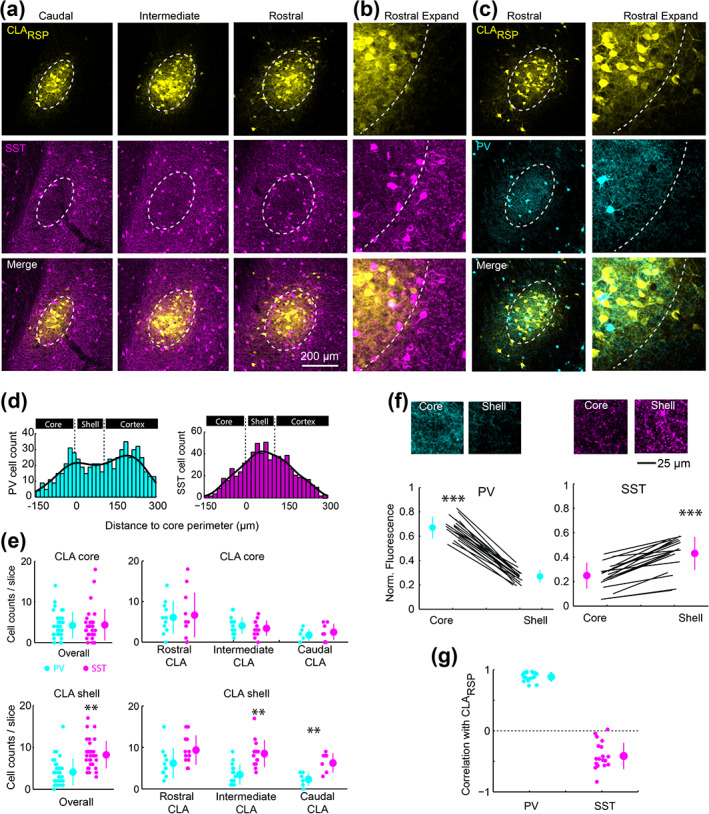
FIGURE 11.

Somatostatin neurons are located in the claustrum shell. (a) Example images showing CLARSP and somatostatin (SST) labeling in the claustrum. (b) An expanded view of panel (a). (c) CLARSP and PV labeling (as in Figure 1) in a brain sections adjacent to panel (a). (d) The spatial distribution of SST and PV neurons relative to the claustrum core/shell perimeter. (e) The number SST and PV neurons in the core and shell of the claustrum across the rostrocaudal axis. The number of PV and SST cells in the core were not different (4.3 ± 3.9 SST cells vs. 4.2 ± 3.1 PV cells/slice, t = 0.36, p = .72, n = 34 slices from five mice). There were more SST cells than PV cells in the shell (8.3 ± 3.3 SST cells vs. 4.1 ± 3.1 PV cells/slice, t = 5.52, p = 2.9 × 10⁻⁶), and this was mainly due to the PV‐SST difference in the intermediate and caudal claustrum. (f) The normalized neuropil fluorescence of PV and SST in the core and shell. Example images are shown above. PV neuropil fluorescence was greater in the core (0.67 ± 0.08 vs. 0.26 ± 0.05, t = 26.9, p = 5.17 × 10⁻¹⁶), whereas SST neuropil was greater in the shell (0.43 ± 0.13 vs. 0.25 ± 0.1, t = 10.1, p = 4.3 × 10⁻⁹). (g) The correlation coefficient between the spatial distribution of CLA RSP and PV (r = .88 ± 0.07, n = 19 slices in three mice) and SST (r = −.41 ± 0.21, n = 20 slices in three mice). **p < .01, *** p < .001 [Color figure can be viewed at wileyonlinelibrary.com]
