Figure 2.
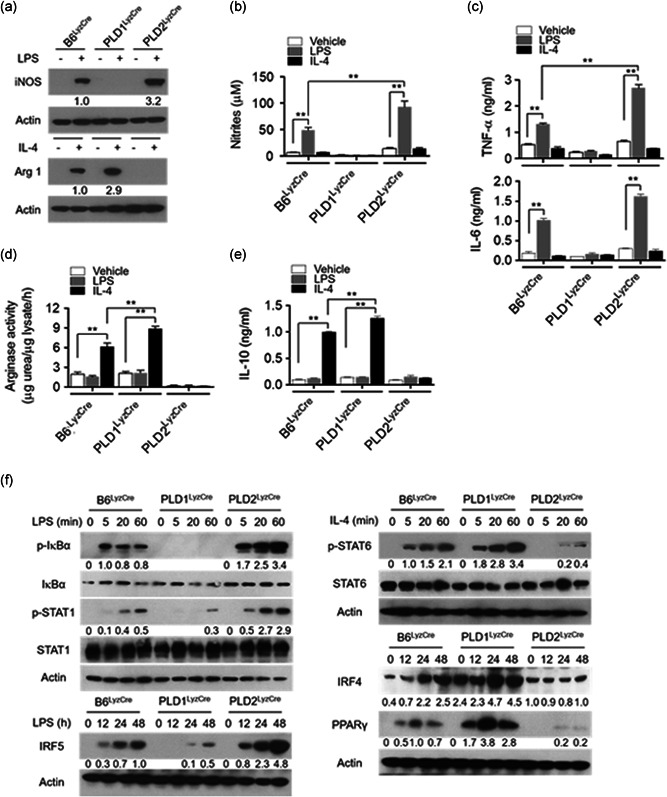
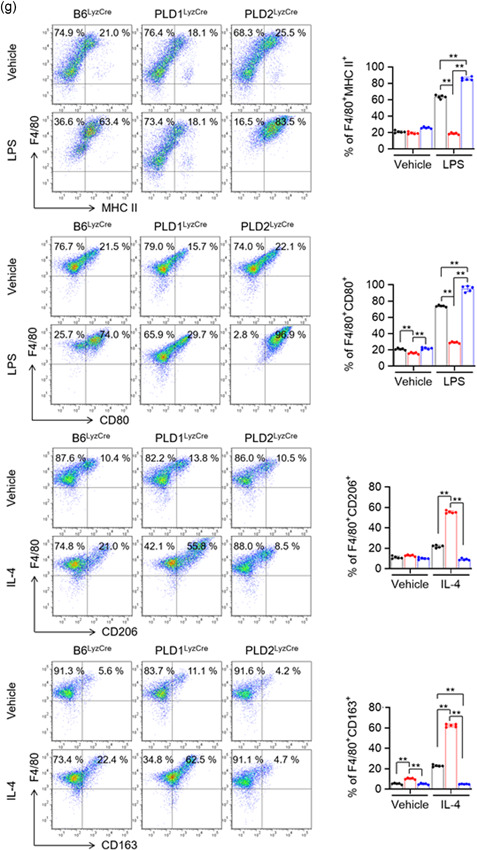
PLD1 and PLD2 are required for M1 polarization and M2 polarization trigged by LPS and IL‐4, respectively. The indicated BMDMs were treated with LPS (100 ng/mL) or IL‐4 (20 ng/ml) for 24 h. (a) The levels of iNOS and Arg1 were analyzed by immunoblotting. (b) Production of nitrites in the culture media was measured. (c) Production of TNF‐α and IL‐6 was measured by ELISA. (d) The lysates were analyzed by for arginase activity in the indicated BMDMs. (e) IL‐10 production was measured by ELISA. (f) The specific BMDMs were treated with LPS or IL‐4 for the indicated time, and the lysates were immunoblotted using the indicated antibodies. (g) The indicated BMDMs were treated with LPS or IL‐4 for 24 h, and the population of CD11b+ F4/80+ M1 marker+ (MHC II and CD80) or M2 marker+ (CD206 and CD163) macrophages was analyzed by flow cytometry and quantified. The intensity of the indicated bands was normalized to the intensity of the actin band and quantified against each other. ∗∗ p < .001 (two‐way ANOVA). Results are representative of at least five independent experiments and presented as the mean ± SD. ANOVA, analysis of variance; BMDMs, bone marrow‐derived macrophages; ELISA, enzyme‐linked immunosorbent assay; IL, interleukin; LPS, lipopolysaccharide; PLD, Phospholipase D; TNF‐α, tumor necrosis factor‐α


