Figure 4.
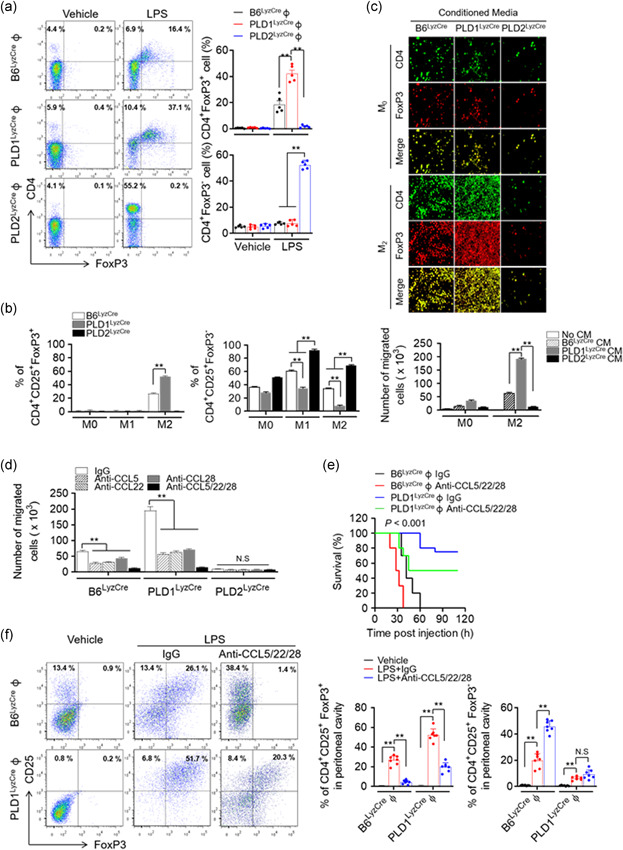
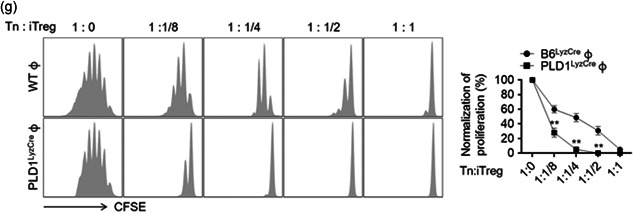
PLD1‐deficient macrophages promote Treg recruitment via CCL5, CCL22, and CCL28, and protect against LPS‐induced sepsis. (a) The indicated BMDMs were injected into Foxp3 RFP mice 24 h before LPS injection. Macrophages from LPS‐injected Foxp3 RFP mice were isolated, and infiltration of Tregs (CD4+FoxP3+) was assessed by flow cytometry and quantified (n = 7 mice per group). (b) M1‐ or M2‐polarized Pld LyzCre macrophages were cocultured with naïve CD4+ T cells of WT mice activated in the presence of antimouse CD3ε antibody (1 μg/ml). Thereafter, the populations of CD4+CD25+Foxp3+ Treg and CD4+CD25+Foxp3− effector T cells were analyzed by flow cytometry and quantified. (c) The transwell membrane chamber was used to evaluate the migration of iTregs that had differentiated from naïve CD4+ T cells of Foxp3 RFP mice after placing the conditioned media (CM) obtained from M1‐ or M2‐polarized Pld LyzCre macrophages in the bottom chamber. Migrated cells were observed by fluorescence microscopy and quantified. (d) Effect of antibodies against the indicated chemokines (100 ng/ml) on the migration of iTregs. B6LyzCre mice were adaptively transferred toto Pld1 LyzCre macrophages, challenged with LPS, and injected with a mixture of neutralizing antibodies (CCL5, CCL22, and CCL28; each 100 μg); thereafter, (e) they were evaluated for survival (n = 10 mice per group). (f) B6LyzCre mice were adoptively transferred toto Pld1 LyzCre macrophages. After 24 h, mice were challenged with LPS and injected with a mixture of neutralizing antibodies (CCL5, CCL22, and CCL28; each 100 μg). Peritoneal cells were analyzed by flow cytometry with CD4+ CD25+ FoxP3+ and quantified (n = 7 mice per group). (g) CFSE‐labeled naïve CD4+ T cells were cocultured with various ratios of iTregs induced from M2‐polarized WT and Pld1 LyzCre BMDMs. After 5 days, CFSE dilution was measured as a readout of the amount of naïve T‐cell proliferation. NS (nonsignificant), ∗∗ p < .001 (one‐way and two‐way ANOVA). Results are representative of at least five independent experiments and are presented as the mean ± SD. ANOVA, analysis of variance; LPS, lipopolysaccharide; PLD, Phospholipase D


