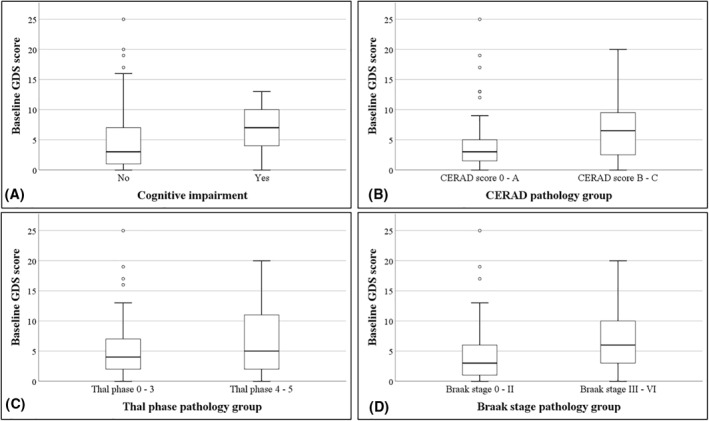
FIGURE 1.

Boxplots comparing baseline Geriatric Depression Scale (GDS)30 scores between cognitive (Panel A) and Alzheimer's disease pathology groups (Panels B, C and D). The boxes represent the interquartile (IQ) range which contains the middle 50% of the records. The whiskers represent the highest and lowest values which are no greater than 1.5 times the IQ range. The line across the boxes indicates the median. Differences between cognitive and pathology groups for baseline GDS30 scores were analysed with the Mann–Whitney U‐Test
