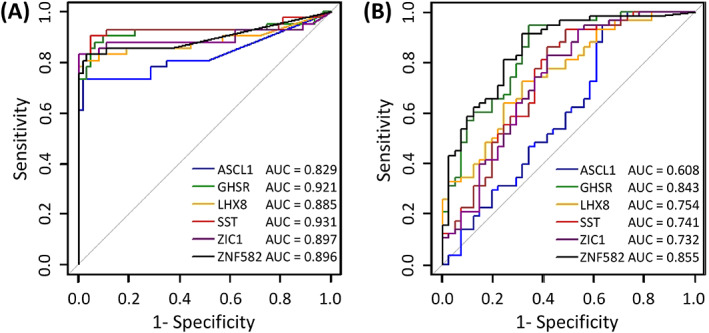
FIGURE 3.

Diagnostic performance of six markers (GHSR, SST, ZIC1, ASCL1, LHX8 and ZNF582) for the ability to distinguish VIN without VSCC from controls (A) and VIN without VSCC from VSCC (B), assessed by univariable logistic regression analysis and visualized with ROC curves and AUCs. AUC, area under the curve; ROC, receiver operating characteristics; VIN, high‐grade vulvar intraepithelial neoplasia; VSCC, vulvar squamous cell carcinoma [Color figure can be viewed at wileyonlinelibrary.com]
