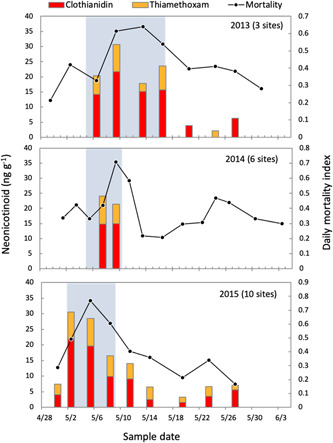
Figure 3.

Temporal variation in worker bee mortality and concentrations of clothianidin and thiamethoxam detected in pollen over the sampling periods in 2013 to 2015. The solid lines depict the daily mortality index (ranging 0–1) averaging across sites for each year. Bars depict average neonicotinoid concentrations in pollen sampled on given dates. Gray blocks indicate the corn‐planting periods identified for each year.
