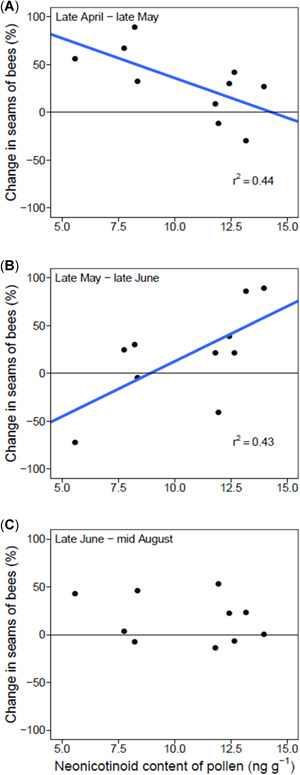
Figure 5.

The relative change in the number of frames occupied by bees plotted against neonicotinoid content over the periods of late April to late May (A), late May to late June (B), and late June to mid‐August (C). Significant relationships are represented by blue regression lines and associated R 2 values.
