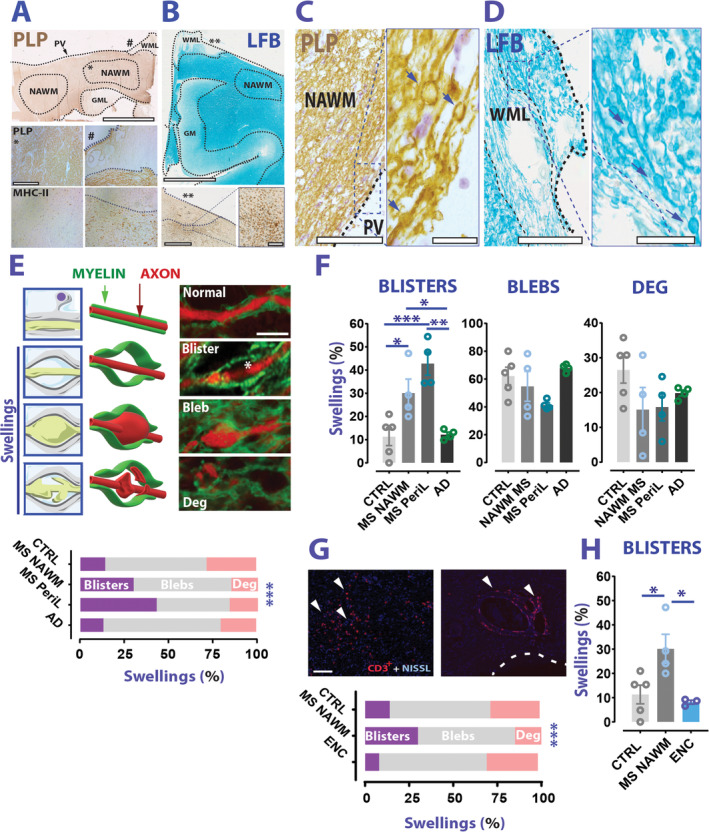
FIGURE 1.

Blistering of AMS presents more frequently in MS than non‐MS WM. (A) Top panel: Example of PLP staining on MS brain sections (brown). The dashed lines indicate a boundary for NAWM, or a WML, or a GML. Bottom panel: Photomicroscope acquisitions of PLP and MHC‐II from the same case show NAWM (*) and a chronic WML (#). Thin‐dotted lines show the lesion borders while thick‐dotted lines mark the periventricular region (PV). (B) Top panel: LFB staining from an MS case. Bottom panel and inset: MHC‐II staining performed on the same case highlights a chronic active lesion (**). (C, D) Examples of PLP and LFB staining images of swelling formations (arrows) retrieved in NAWM (left) and lesion/perilesion (right) of MS cases. (E) Top panel: Cartoons (left), 3D drawings (middle), and examples (right) of the different types of swelling analyzed. Bottom graph: Distribution of swelling types among CTRL, MS, and AD (chi squared test; chi squared (6) = 108.6; p < 0.0001). (F) Blister percentage is significantly increased in MS than CTRLs and AD (Blisters: 1‐way ANOVA; F(3,13) = 12.17; p = 0.0004; Sidak's multiple comparison test; p = 0.031 MS NAWM vs CTRLs; p = 0.0009 MS perilesion vs CTRLs; p = 0.042 MS NAWM vs AD; p = 0.002 MS perilesion vs AD; blebs: Brown‐Forsythe ANOVA; F(3.0,5.563) = 3.156; p = 0.114 CTRLs vs MS vs AD; degenerative: 1‐way ANOVA; F(3,13) = 1.675; p = 0.221 CTRLs vs MS vs CTRLs). (G) Top panel: Examples of inflammatory regions in the WM of an encephalitis case. Arrowheads indicate CD3+ cells. Dotted line indicates the ventricular region. Bottom graph: distribution of swelling types between CTRLs, MS NAWM, and encephalitis (ENC) WM (chi squared test; chi squared (6) = 108.6; p < 0.0001). (H) Blister percentage is significantly higher in MS NAWM than EN WM (Blisters: 1‐way ANOVA; F (2,9)=6.672; p = 0.0167; Sidak's multiple comparison test; p = 0.032 MS NAWM vs ENC). Scale bars: 5 mm in A (top panel) and B; 500μm in A (bottom panel); 1mm in B bottom panel (inset scale bar is 200μm); 200μm in C and D (inset is 25μm); 2.5μm in E, 100μm in G. Data in F, H are reported as mean ± SEM. *p < 0.05; **p < 0.01; ***p < 0.001. AD = Alzheimer's disease; AMS = axo‐myelinic synapse; ANOVA = analysis of variance; CTRL = control; GM = grey matter; GML = grey matter lesion; LFB = Luxol Fast Blue; MHC II = major histocompatibility complex II; MS = multiple sclerosis; NAWM = normal appearing white matter; PLP = proteolipid protein; WML = white matter lesion.
