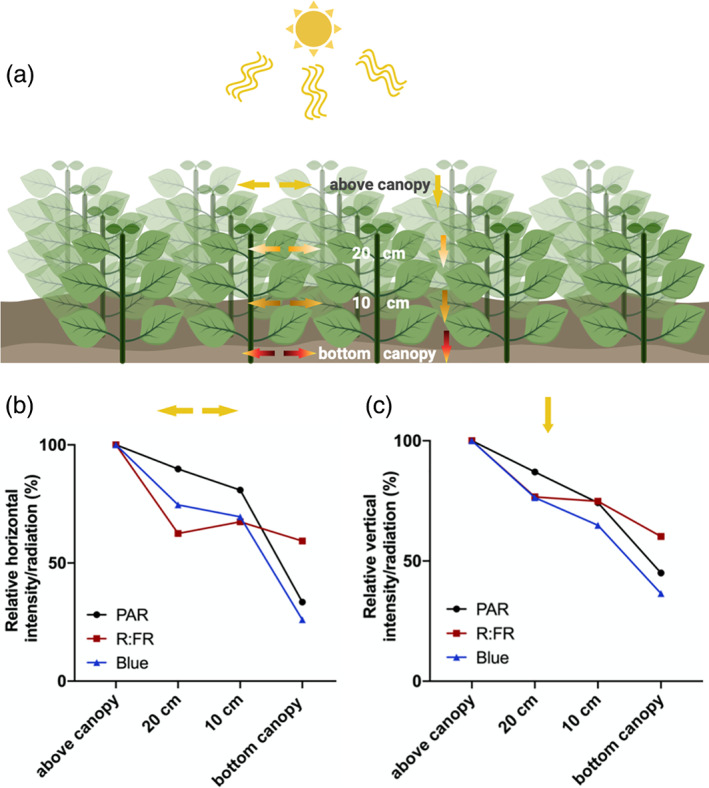
FIGURE 1.

Changes in light quality and quantity in different canopy strata. (a) The cartoon illustrates a basil (Ocimum basilicum) canopy in which PAR (photosynthetic active radiation), blue (λ = 400–499) and R:FR (red to far‐red ratio; [R (λ = 650–670): FR (λ = 720–740)]) were measured at different canopy heights. Arrows illustrate the directions of the light measurements at the different heights. (b, c) Quantifications of horizontally (b) or vertically (c) measured PAR (black line), blue (blue line) and R:FR (red line) light at the different canopy heights (above canopy, 20 cm, 10 cm and bottom canopy), expressed as percentage of the values measured above the canopy. The basil canopy consisted of 20 plants that were transplanted 6 days after germination, in a checkerboard pattern with 15 cm distance from each other. The canopy height was 30 cm from soil level. Graphs show light measurements made with a LI‐COR LI‐180 spectrometer, using a cosine corrected sensor, in a 37‐day‐old canopy (n = 3). The experiment was performed in the greenhouse facilities of Utrecht University. Created with BioRender.com [Colour figure can be viewed at wileyonlinelibrary.com]
